Visualizing Deep Feature for Document Image Analysis
Title: Visualizing Deep Feature for Document Image Analysis
Authors : Ajoy Mondal, Peter Lipps and C. V. Jawahar
Abstract
Recent studies shows that the deep Convolutional Neural Networks (cnn)s have performed impressively well on document image analysis tasks (e.g. document classification, degraded document bina- rization, layout analysis, table detection, etc). Possibly, there is no such systematic study to know why deep cnns perform so well for document image analysis tasks. On the contrary, there are a number of attempts in recent years to analyze why (and how) deep cnns have performed well on natural image classification tasks. Popular approaches visualize the features (layer-wise) learned by the network. As per our knowledge, there is only one existing work [35] to analyze and visualize learned features by a deep network for document image classification task. In this paper, we explore the layer-wise feature visualization technique proposed by Zeiler and Fergus [40] for various document image analysis tasks — document figure classification, script classification, and docu- ment image classification. This technique projects the feature activation back to the input pixel space using a multi-layered Deconvolutional Net- work (deconvnet) to visualize the learned features. Experimental results show that the deep cnns learn features and it can be interpreted.
Keywords: Document analysis · deep convolutional network · feature visualization · deconvolutional network.
What do CNNs learn from document images?
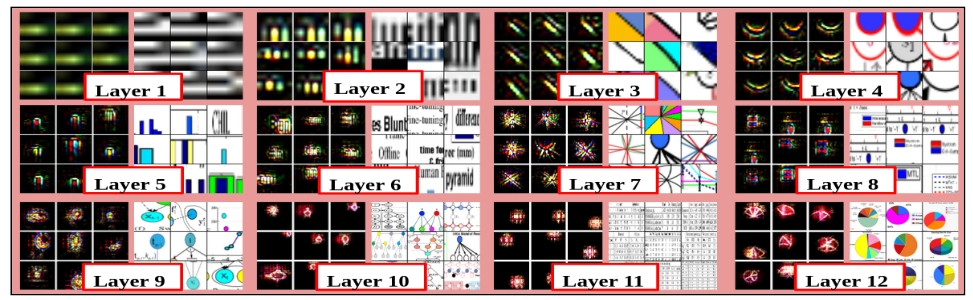
Fig. 1: What do cnns learn from document images? This figure depicts the fea- ture hierarchy learned by a deep cnn while classifying figures. As can be ob- served, the initial layers learn simple generic features and later layers learn figure specific features.
Deep Feature Visualization Model
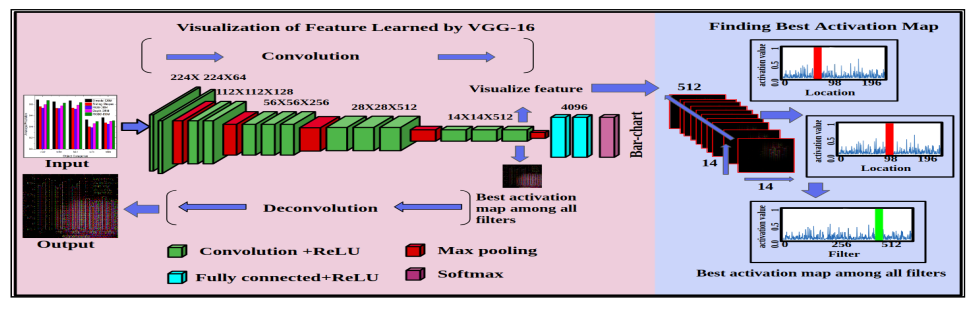
Fig. 2: Block diagram of used deep feature visualization model. To visualize learned feature of an input image in a particular layer of deep Convolutional Network, it finds the best activation map among all the filters in this layer. After the best activation map is projected to the pixel space through a decon- volutional network and visualize the learned feature map.
Dataset:
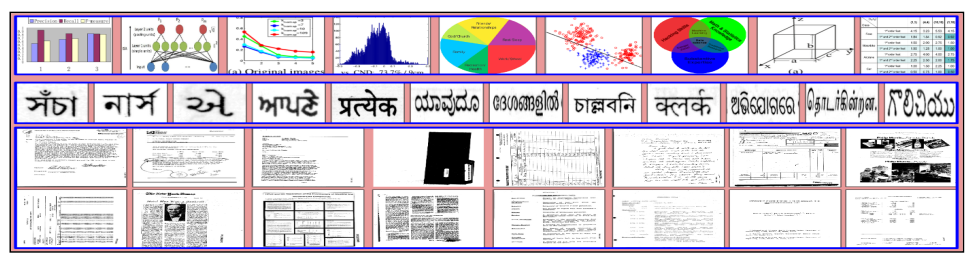
Fig. 3: Sample images from training set of different datasets. First Row: shows images of docfigure dataset. Second Row: shows images of script-67k dataset. Third and Fourth Rows: shows images of rvl-cdip dataset.
Feature Visualization using Deconvnet
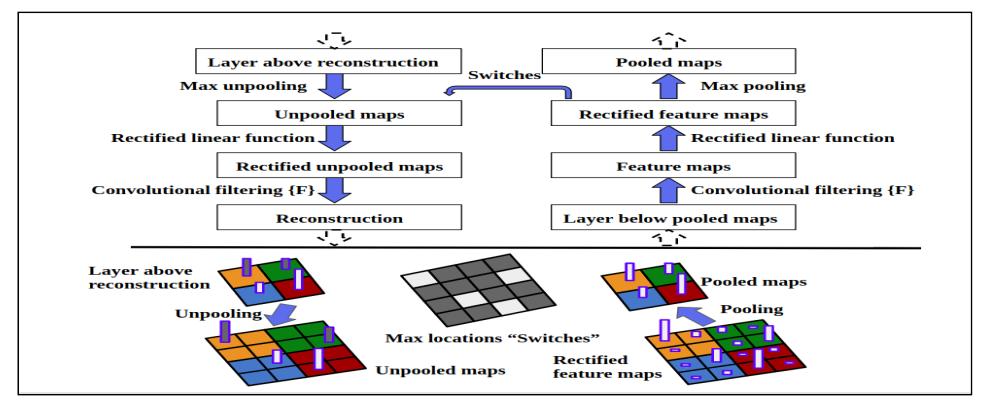
Fig. 4: Redrawing of Zeiler et al. [41] deconvnet model. Top: A deconvnet layer (left) attached to a convnet layer (right). The deconvnet will reconstruct an approximate version of the convnet features from the layer beneath. Bottom: An illustration of the unpooling operation in the deconvnet, using switches which record the location of the local max in each pooling region (colored zones) during pooling in the convnet. The black/white bars are negative/positive activations within the feature map.
Learned Convolution Features Visualization for Document Figure Classification
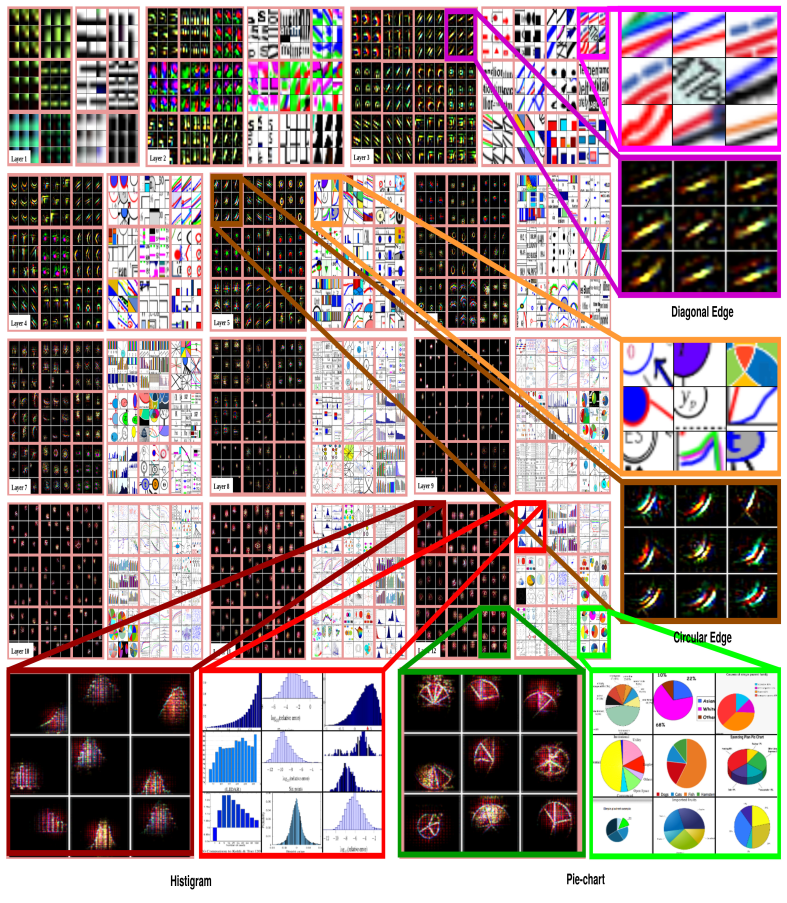
Fig. 5: Visualization of learned features correspond to test set of docfigure dataset, in a fully trained model. For layers 1-12, it shows the top 9 activations in a random subset of feature maps across the test set. The learned features are projected into pixel space to visualize features using the deconvolutional net- work (deconvnet). For each feature map, we also show the corresponding image patch. We observe that (i) the strong grouping within each feature map, (ii) greater invariance at higher layers and (iii) exaggeration of discriminative parts of the image, e.g. circular parts of Flow-chart (Layer4: r1, c1). Best viewed in electronic form.
Learned Convolution Features Visualization for Document Image Classification
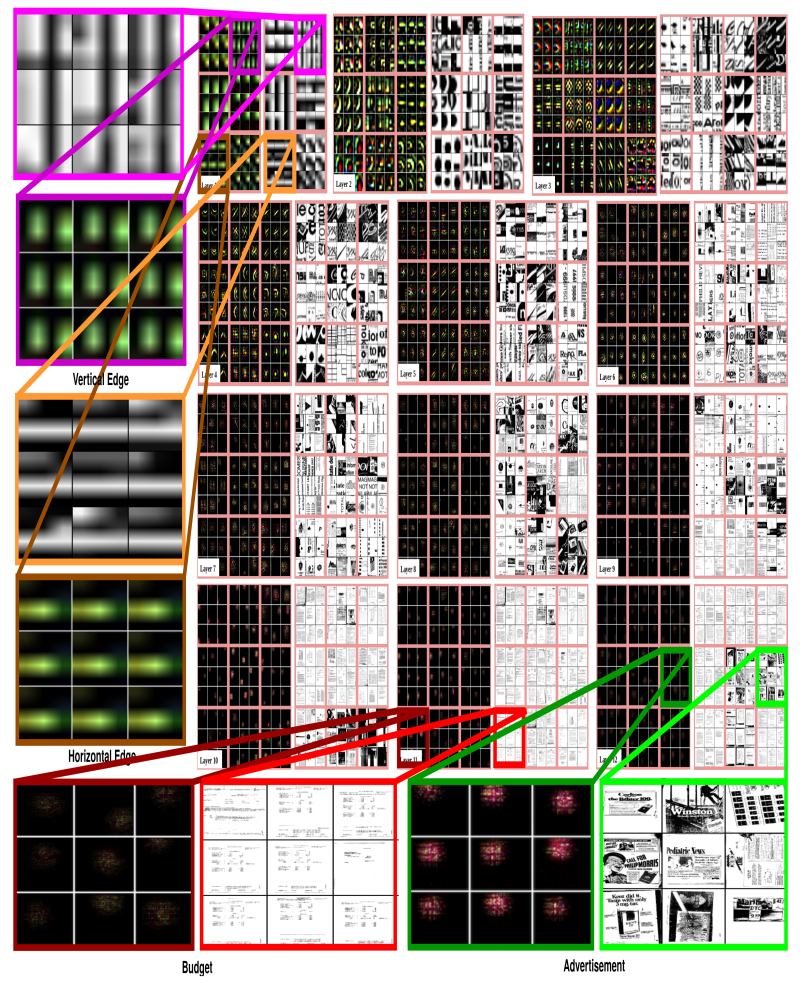
Fig. 6: Visualization of learned features correspond to validation set of rvl-cdip dataset, in a fully trained model. For layers 1-12, it shows the top 9 activations in a random subset of feature maps across the validation set. The learned features are projected into pixel space to visualize features using the deconvolutional network (deconvnet). For each feature map, we also show the corresponding image patch. Best viewed in electronic form.
Learned Convolution Features Visualization for Script Classification
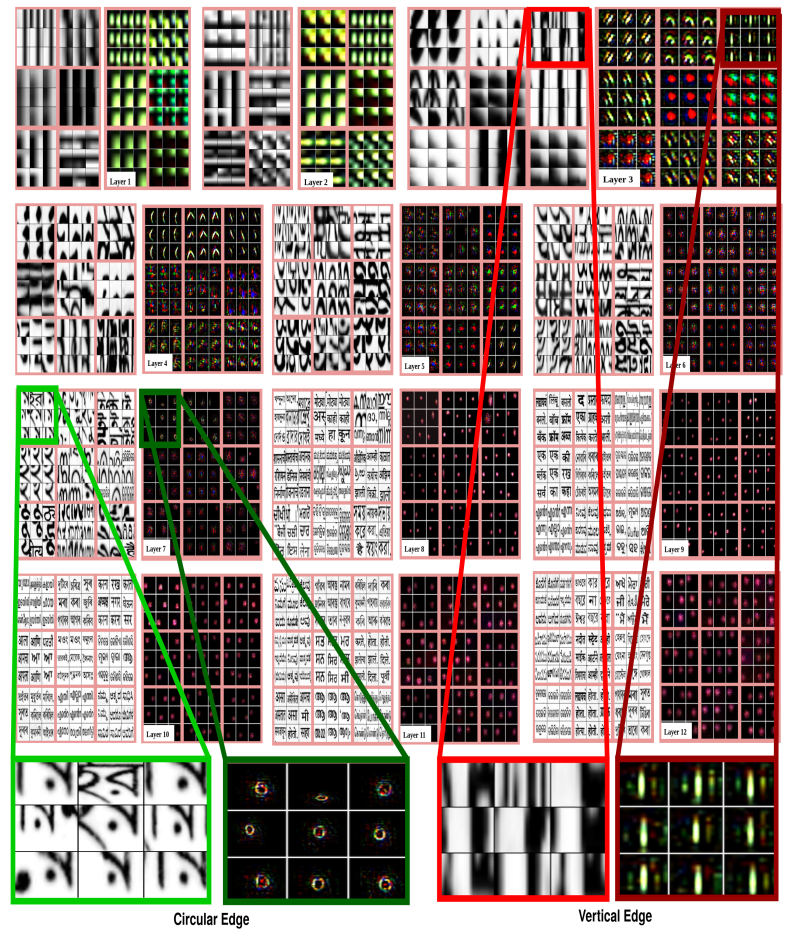
Fig. 7: Visualization of learned features correspond to test set of script-67k dataset, in a fully trained model. For layers 1-12, it shows the top 9 activations in a random subset of feature maps across the test set. The learned features are projected into pixel space to visualize features using the deconvolutional network (deconvnet). For each feature map, we also show the corresponding image patch. Best viewed in electronic form.
Convolution Feature Evolution during Training
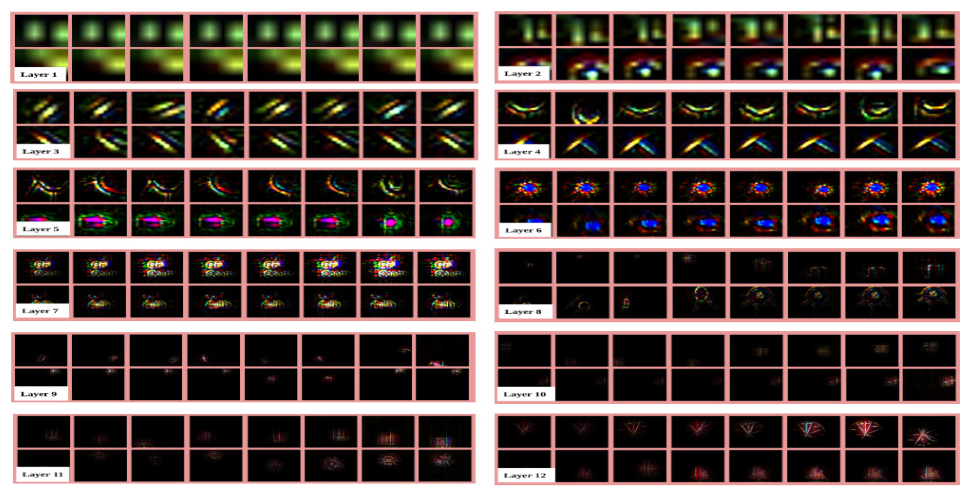
Fig. 8: Evolution of features learned by the network during training. Subset of features of each layer at different epochs [1, 2, 5, 10, 20, 40, 70, 100] are displayed. The figure is best viewed in electronic form.
Summary and Observations
This paper presents the exploration of deconvnet for visualization of feature maps learned by the Convolutional Neural Networks for various document image analysis tasks. Deconvnet projects the learned feature maps into pixel space to interpret those feature maps. We explore visualization for three different tasks - document figure classification, document image classification and script clas- sification.
- The initial layers of the network learn more generic features while higher layers learn class specific features.
- Initial layers of the deep cnns can be converged within a few numbers of epochs, however, the higher layers can be converged after a desired number of epochs.
Link to the Download: [ Dataset ] , [ Code ] & [ pdf ]
Publication
- Ajoy Mondal, Peter Lipps, and C V Jawahar , Visualizing Deep Feature for Document Image Analysis , In Proceeding of International Workshop on Document Analysis Systems 2020.
Bibtex
Updatd Soon