Graphical Object Detection in Document Images
Title: Graphical Object Detection in Document Images
Authors : Ranajit Saha, Ajoy Mondal and C. V. Jawahar
Abstract
Graphical elements: particularly tables and figures contain a visual summary of the most valuable information contained in a document. Therefore, localization of
such graphical objects in the document images is the initial
step to understand the content of such graphical objects or
document images. In this paper, we present a novel end-to-end
trainable deep learning based framework to localize graphical
objects in the document images called as Graphical Object
Detection (GOD). Our framework is data-driven and does not
require any heuristics or meta-data to locate graphical objects
in the document images. The GOD explores the concept of
transfer learning and domain adaptation to handle scarcity of
labeled training images for graphical object detection task in
the document images. Performance analysis carried out on the
various public benchmark data sets: ICDAR-2013, ICDAR-POD2017 and UNLV shows that our model yields promising results
as compared to state-of-the-art techniques.
Keywords: Graphical object localization; deep neural network; transfer learning; data-driven.
Graphical Object Detection
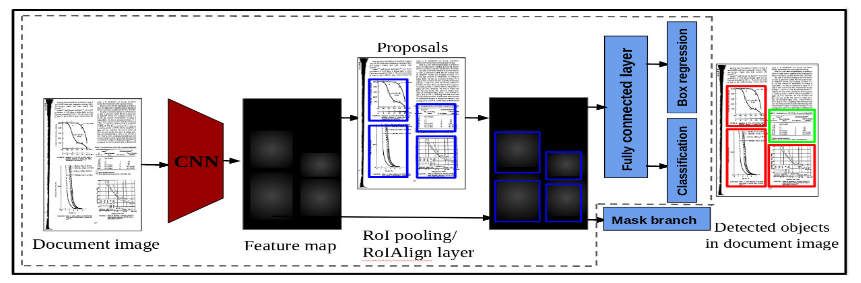
Figure 2: GOD framework. The model takes an image as input and generates the feature map.RPN proposes the region based on the feature map. Detection network uses the proposed regions and feature map to detect various graphical objects
Experiments
Ablation Study
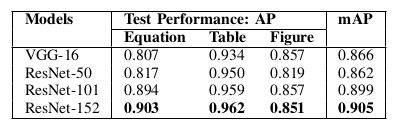
Table I: Performances of different backbone models on ICDAR-POD 2017 with IoU threshold 0.6. Deeper pre-trained model obtains higher detection accuracy. AP : average precision. Bold value indicates the best result.
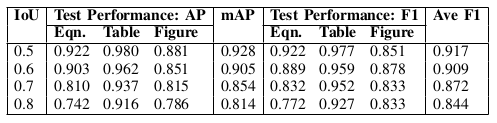
Table II: Greater IoU threshold reduces the performance of the GOD (Faster R-CNN ) model on ICDAR-POD 2017 due to reduction in number of true positives.
Graphical Object Detection in Document Images
Comparison with the state-of-the-arts on ICDAR-POD 2017
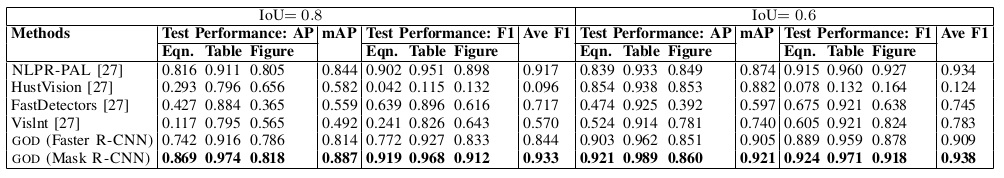
Table III: Comparison with state-of-the-arts based on mAP and Ave F1 with IoU = 0.8 and 0.6, respectively on ICDAR-POD 2017 data set. Our GOD (Mask R-CNN ) is better than state-of-the-arts while IoU = 0.8 and IoU = 0.6. Bold value indicates the best result.
Table Detection in Document Images
Comparison with the state-of-the-arts on ICDAR-2013:
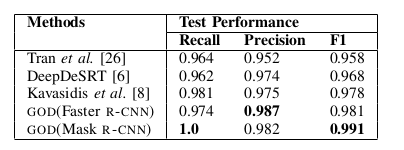
Table IV: Comparison with state-of-the-arts based on recall, precision and F1 with IoU = 0.5 on ICDAR-2013 data set. Bold value indicates the best result.
Comparison with the state-of-the-arts on UNLV
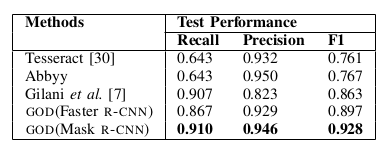
Table V: Comparison with state-of-the-arts on UNLV data set based on recall, precision and F1 with IoU = 0.5. Bold value indicates the best result.
Results on GO-IIIT-5K data set
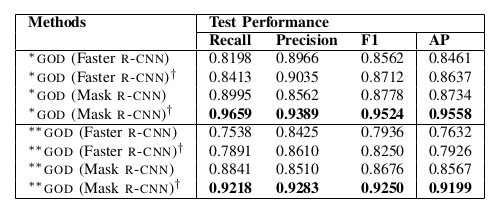
Table VI: Performance of the trained GOD model on GO-IIIT-5K with IoU = 0.5. GOD: trained on public benchmark ICDAR-2013, ICDAR-POD 2017, UNLV and Marmot data sets and tested on test images of GO-IIIT-5 K data set. GOD†: trained on the public benchmark ICDAR -2013, ICDAR-POD 2017, UNLV and Marmot data sets, then fine-tuned on training images and tested on test images of GO-IIIT-5K data set. ‘*’ indicates that data set is randomly divided into training and test sets. ‘**’ indicates that data set is divided into training and test sets based on company. Bold value indicates the best result.
Qualitative Results
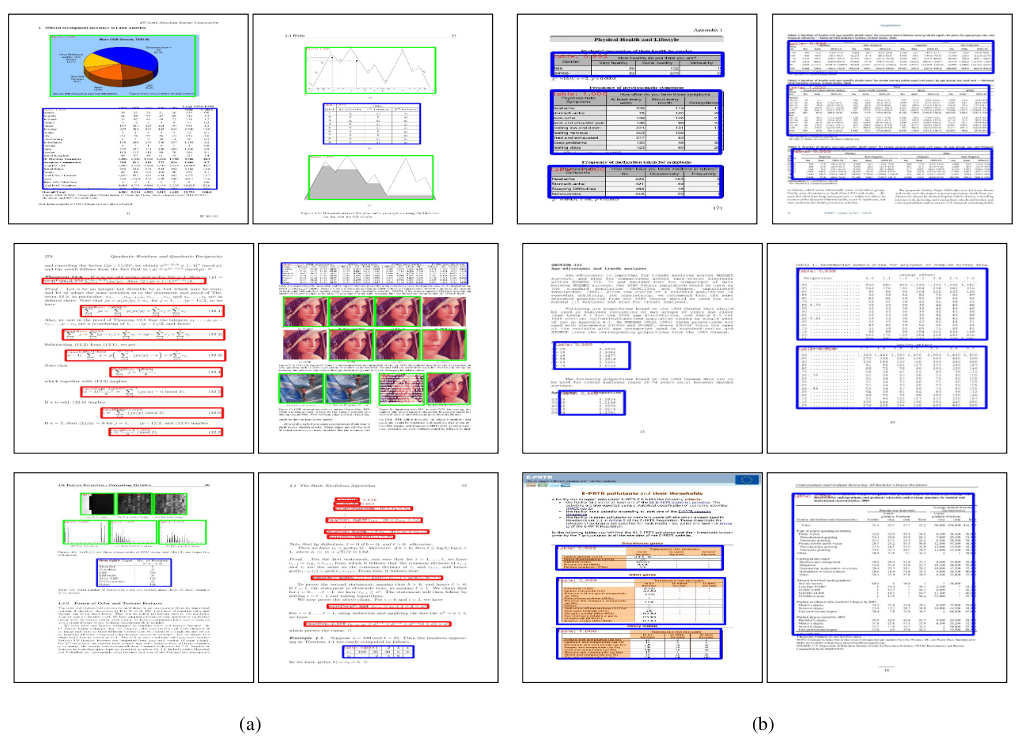
Figure 3: (a) Results of graphical objects: table, figure and equation localization using the GOD (Mask R-CNN ) on ICDAR-POD 2017 data set. Blue, Green and Red colors represent the predicted bounding boxes of table, figure and equation, respectively. (b) Results of table localization using the GOD (Mask R-CNN ) in the document images of ICDAR-2013 data set. Blue color represents the predicted bounding box of the table.
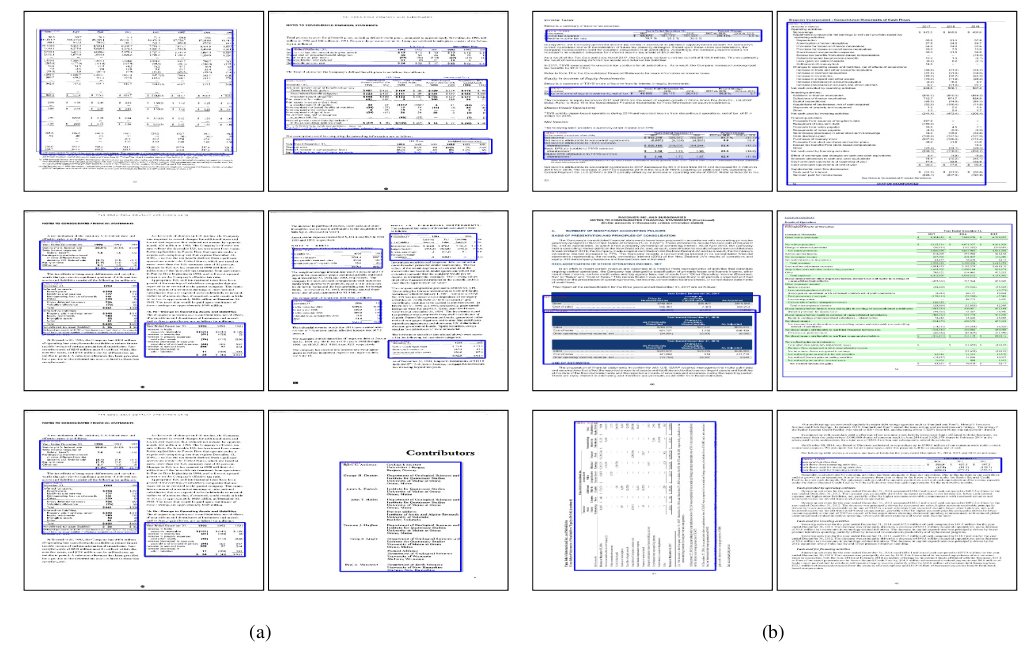
Figure 4: (a) Results of the table localization using GOD (Mask R-CNN ) in the document images of UNLV data set. (b) Results of table localization using the GOD (Mask R-CNN ) in the document images of GO-IIIT-5K data set. Blue color represents the predicted bounding box of the table.
Failure Exaple
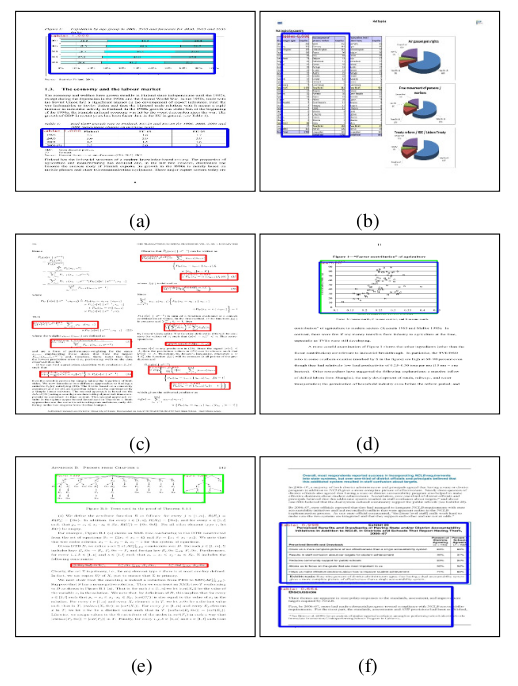
Figure 5: Examples where the GOD fails to accurately localize the graphical objects. (a) figure is detected as table. (b) table is partially detected (here, object of interest is table). (c) some equations are not detected. (d) figure is detected as both figure and table. (e) single figure is detected as multiple figures. (f) paragraph is detected as table. Blue, Green and Red colors represent the predicted bounding boxes of table, figure and equation, respectively.
Link to the Download: [ Dataset ] , [ Code ] & [ PDF ]
Publication
- Ranajit Saha, Ajoy Mondal and C. V. Jawahar , Graphical Object Detection in Document Images , International Conference on Document Analysis and Recognition (ICDAR) 2019.
Cite this paper as:
@inproceedings{saha2019graphical,
title={Graphical Object Detection in Document Images},
author={Saha, Ranajit and Mondal, Ajoy and Jawahar, C V},
booktitle={2019 International Conference on Document Analysis and Recognition (ICDAR)},
pages={51--58},
year={2019},
organization={IEEE}
}
Team
- Ranajit Saha
- Dr. Ajoy Mondal
- Prof. C. V. Jawahar