Textual Description for Mathematical Equations
Title: Textual Description for Mathematical Equations
Authors : Ajoy Mondal and C. V. Jawahar
Abstract
Reading of mathematical expression or equation
in the document images is very challenging due to the large
variability of mathematical symbols and expressions. In this
paper, we pose reading of mathematical equation as a task
of generation of the textual description which interprets the
internal meaning of this equation. Inspired by the natural
image captioning problem in computer vision, we present
a mathematical equation description ( MED ) model, a novel
end-to-end trainable deep neural network based approach
that learns to generate a textual description for reading
mathematical equation images. Our MED model consists of a
convolution neural network as an encoder that extracts features
of input mathematical equation images and a recurrent neural
network with attention mechanism which generates description
related to the input mathematical equation images. Due to
the unavailability of mathematical equation image data sets
with their textual descriptions, we generate two data sets for
experimental purpose. To validate the effectiveness of our MED
model, we conduct a real-world experiment to see whether the
students are able to write equations by only reading or listening
their textual descriptions or not. Experiments conclude that the
students are able to write most of the equations correctly by
reading their textual descriptions only.
Keywords: Mathematical symbols; mathematical expressions;
mathematical equation description; document image; convolution neural network; attention; recurrent neural network.
Mathematical Equation Description
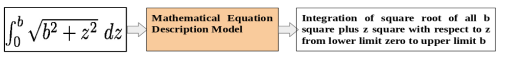
Figure 1: Our model treats reading of mathematical equation in a document image as generation of textual description which interprets the internal meaning of this equation.
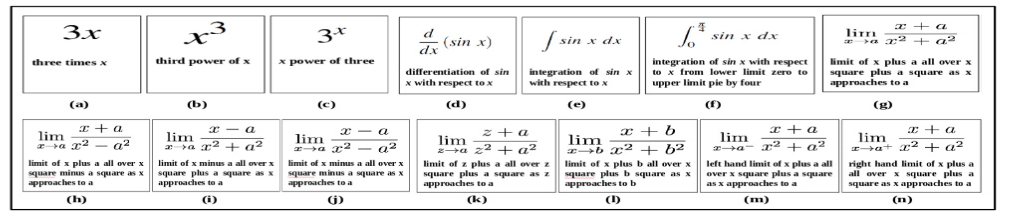
Figure 2: Example of sensitivity of variables, operators and their positions while reading the equations. Only ‘3’ in (a) is changing position in (b), ‘x’ in (a) is changing position in (c), ‘differentiation operator’ in (d) is changed by ‘integration’ in (e), and ‘differentiation operator’ in (d) is changed by ‘finite integration’ in (f), ‘+’ operator in denominator of (g) is changed by ‘−’ in (h), ‘+’ operator in nominator of (g) is changed by ‘−’ in (i), ‘+’ operators in both nominator and denominator of (g) are changed by ‘−’ in (j), variable ‘x’ in (g) is changed by ‘z’ in (k), constant ‘a’ in (g) is changed by ‘b’ in (l), limit value ‘a’ in (g) is replaced by limit value ‘a − ’ in (m), and limit value ‘a’ in (g) is changed to ‘a + ’in (n).
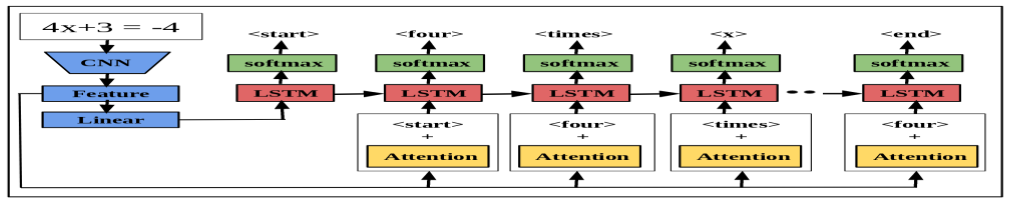
Figure 3: Overview of mathematical expression description network. Our model uses a end-to-end trainable network consisting of CNN followed by a language generating LSTM . It generates textual description of an input mathematical expression image in natural language which interprets its internal meaning.
Experiment
Dataset
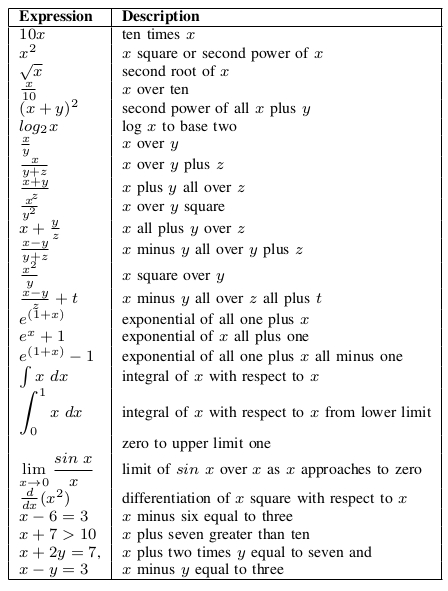
Table I: Natural language phrases to uniquely describe mathematical equations.
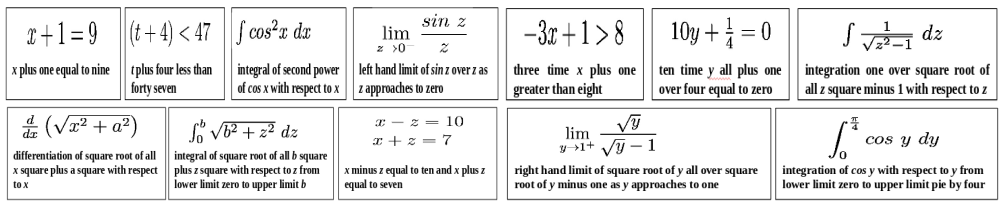
Figure 4: Few sample MEI and their corresponding textual description of Math-Exp-Syn data set.
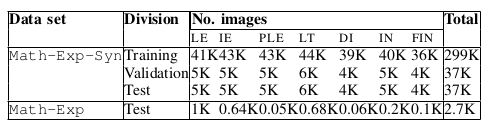
Table II: Category level statistics of considered data sets. LE : linear equation, IE : inequality, PLE : pair of linear equations, LT : limit, DI : differentiation, IN : integral and FIN : finite integral.
Experiments and Results
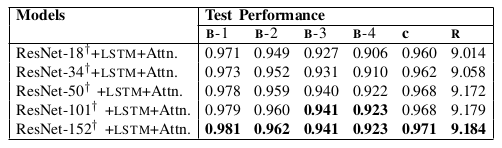
Table III: It illustrates that the deeper pre-trained model gets better representation and improves textual description accuracy with respect to three evaluation measures: BLEU -1 ( B -1), BLEU -2 ( B -2), BLEU -3 ( B -3), BLEU -4 ( B -4), CIDE r ( C ) and ROUGE ( R ) . Number along with the model refers to the depth of the corresponding model. ‘ † ’ denotes that the encoder is fine-tuned during training. LSTM with attention is considered as a decoder.
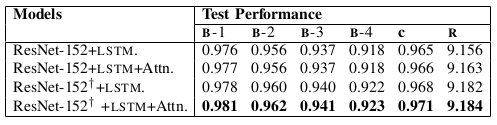
Table IV: Quantitative illustration of effectiveness of fine- tuning the encoder and attention in decoder during training on MED task. ‘†’ denotes fine-tune.
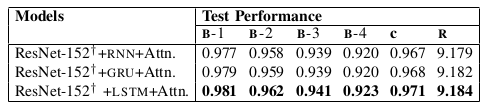
Table V: Performance comparison between RNN , GRU and LSTM with attention mechanism on the mathematical equa- tion description task. We fine-tune the encoder during train- ing process.
Quantitative Results
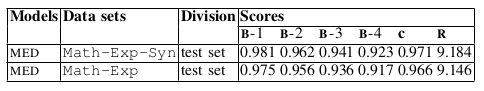
Table VI: Quantitative results of our MED model on stan- dard evaluation metrics for both Math-Exp-Syn and Math-Exp data sets. Both the cases MED is trained using training set of Math-Exp-Syn data set.
Quantitative Results
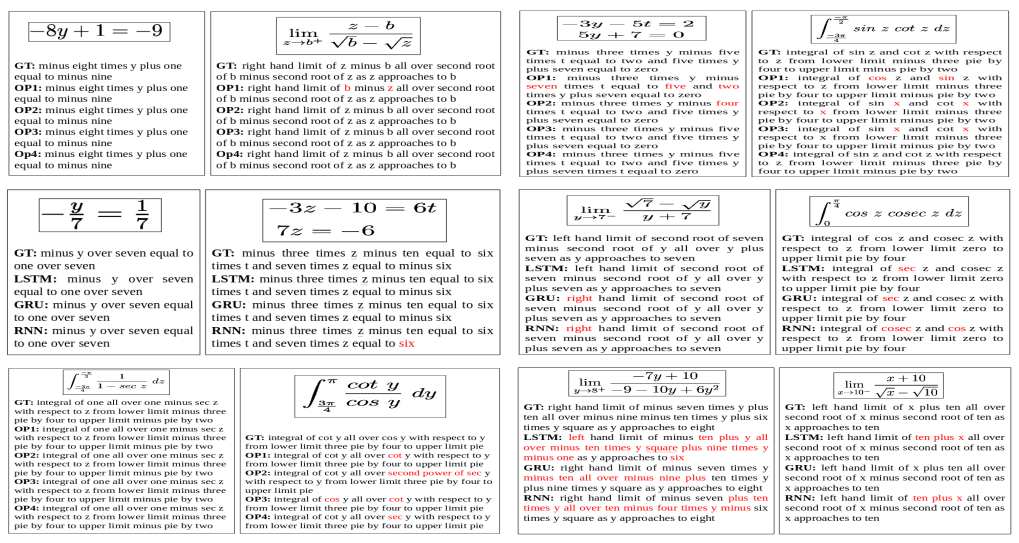
Figure 5: Visual illustration of sample results of test Math-Exp-Syn data set produced by our MED framework. GT : ground truth description, OP 1: description generated by ResNet152+ LSTM , OP 2: description generated by ResNet152+ LSTM +Attn., OP 3: description generated by ResNet152 † + LSTM and OP 4: description generated by ResNet152 † + LSTM +Attn., LSTM : description generated by ResNet152 † + LSTM +Attn., GRU : description generated by ResNet152 † + GRU +Attn., RNN : description generated by ResNet152 † + RNN +Attn., † indicates fine-tune and Attn. denotes attention in decoder. Red colored text indicates wrongly generated text.
Real world Experiments
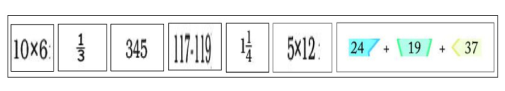
Figure 6: Sample cropped mathematical equation images from NCRT class V mathematics book for real world experiment.
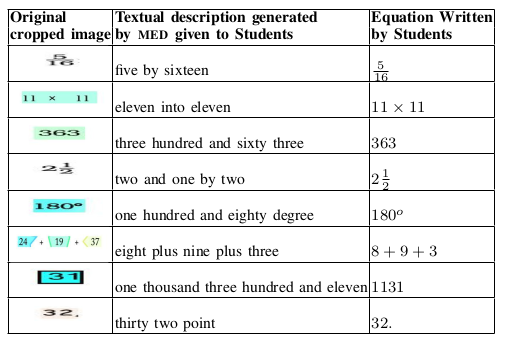
Table VII: Summary of real world experiments. First Column: cropped equation images. Second Column: textual descriptions generated by the MED and given to the students and ask them to write corresponding equations by reading the descriptions. Third Column: equations written by the students.
Link to the Download: [ Dataset ] , [ Code ] & [ pdf ]
Publication
- Ajoy Mondal and C V Jawahar , Textual Description for Mathematical Equations , In Proceeding of .
Bibtex
Updated Soon.