Table Structure Recognition using Top-Down and Bottom-Up Cues
Title: Table Structure Recognition using Top-Down and Bottom-Up Cues
Authors :Sachin Raja, Ajoy Mondal, and C. V. Jawahar
Abstract
Tables are information-rich structured objects in document images. While significant work has been done in localizing tables as graphic objects in document images, only limited attempts exist on table structure recognition. Most existing literature on structure recognition depends on extraction of meta-features from the pdf document or on the optical character recognition (OCR) models to extract low-level layout features from the image. However, these methods fail to generalize well because of the absence of meta-features or errors made by the OCR when there is a significant variance in table layouts and text organization. In our work, we focus on tables that have complex structures, dense content, and varying layouts with no dependency on meta-features and/or OCR.
We present an approach for table structure recognition that combines cell detection and interaction modules to localize the cells and predict their row and column associations with other detected cells. We incorporate structural constraints as additional differential components to the loss function for cell detection. We empirically validate our method on the publicly available real-world datasets - ICDAR-2013, ICDAR-2019 (cTDaR) archival, UNLV, SciTSR, SciTSR-COMP, TableBank, and PubTabNet. Our attempt opens up a new direction for table structure recognition by combining top-down (table cells detection) and bottom-up (structure recognition) cues in visually understanding the tables.
Keywords: Document image, table detection, table cell detection, row and column association, table structure recognition.
TabStruct-Net
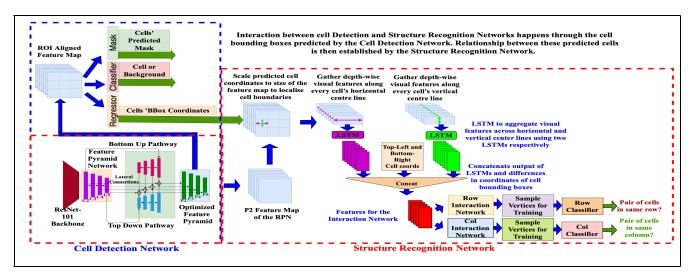
Fig. 1. Our tabstruct-net. Modified rpn in cell detection network, which consists of both top-down and bottom-up pathways to better capture low-level visual features. P2 layer of the optimized feature pyramid is used in the structure recognition network to extract visual features.
Evaluation Measures
Micro-averaged: In this case, the confusion matrix parameters are gathered across all the data points collectively in the test dataset to compute precision, recall and F1 scores.
Macro-averaged: In this case, the confusion matrix parameters are gathered individually and then averaged across all the documents in the test dataset to compute precision, recall and F1 scores.
Experimental Setup
Micro-averaged: Setup-A (S-A) where only table image is used as an input to the structure recognition model
Setup-B (S-B) where table image along with additional meta-features such as low-level content bounding boxes are used as an input to the structure recognition model.
Results on Table Structure Recognition
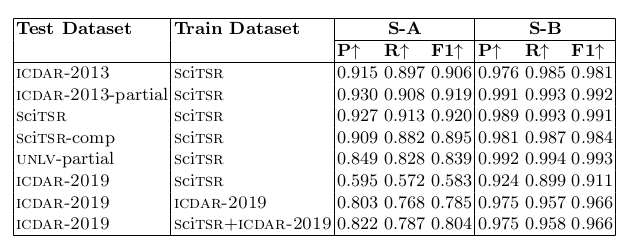
Table 2. shows the performance of our TabStruct-Net for physical table structure recognition on various benchmark datasets.
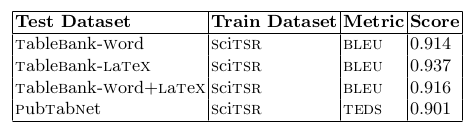
Table 3. shows the performance of our TabStruct-Net for logical table structure recognition on various benchmark datasets.
Micro-averaged Results
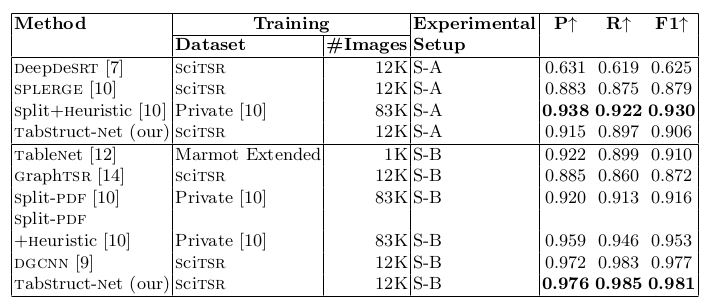
Table 4. Comparison of results for physical structure recognition on ICDAR-2013 dataset. #Images: indicates number of table images in the training set. Heuristic: indicates dataset specific cell merging rules for various models in [10].
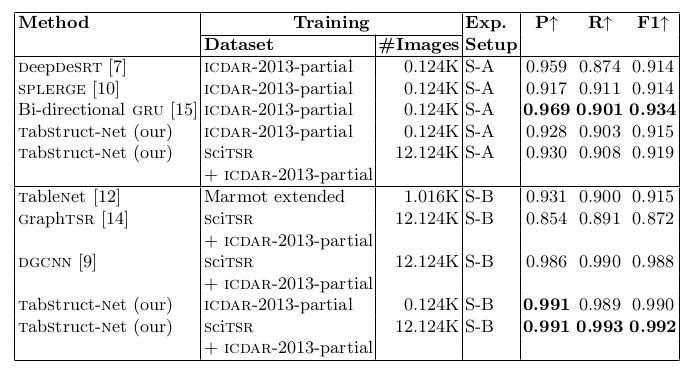
Table 5. Comparison of results for physical structure recognition on ICDAR-2013-partial dataset. P: indicates precision, R: indicates recall, F1: indicates F1 Score and #Images: indicates number of table images in the training set.
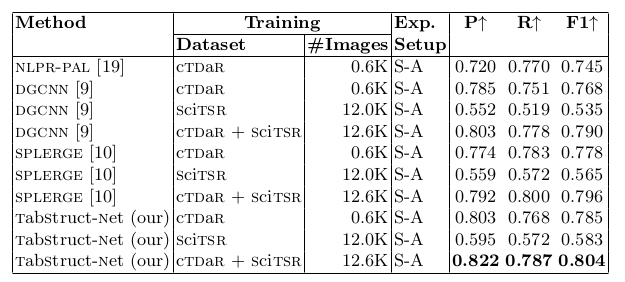
Table 6. Comparison of results for physical structure recognition on ICDAR-2019 (cTDaR) archival dataset. For comparison against DGCNN [9], we use the cell bounding boxes detected from TabStruct-Net for a fair comparison. P: indicates precision, R: indicates recall, F1: indicates F1 Score and #Images: indicates number of table images in the training set.
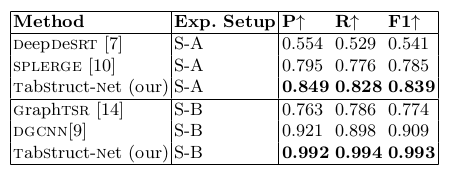
Table 7. Comparison of results for physical structure recognition on UNLV-partial dataset. P: indicates precision, R: indicates recall, F1: indicates F1 Score. All models are trained on SciTSR and fine-tuned on UNLV-partial datasets.
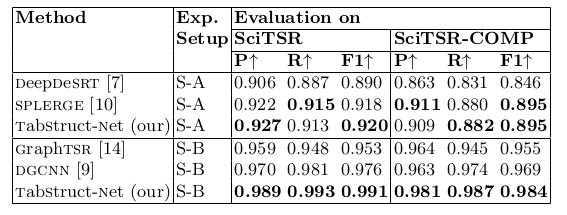
Table 8. Comparison of results for physical structure recognition on SciTSR and SciTSR-COMP datasets. P: indicates precision, R: indicates recall, F1: indicates F1 Score. All the models are trained on SciTSR dataset.
Average Results on Markup Output
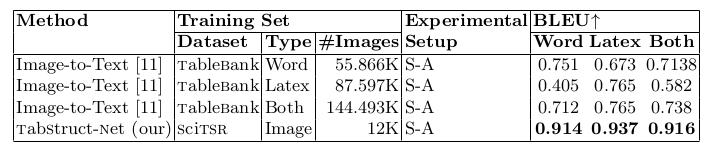
Table 9. Comparison of results for logical structure recognition on TableBank dataset.
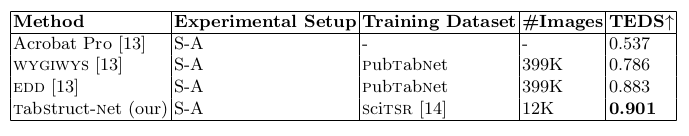
Table 10. Comparison of results for logical structure recognition on PubTabNet dataset [13]. TEDS: indicates averaged tree edit distance based similarity [13].
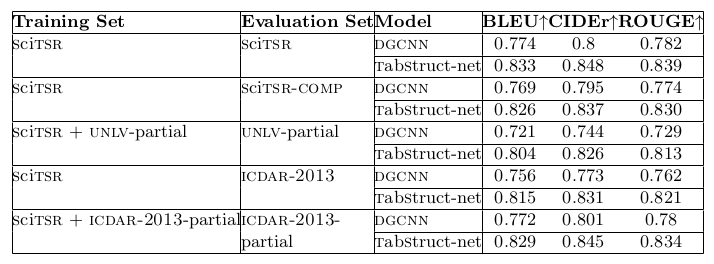
Table 11. Results comparison of various methods for table structure recognition on various datasets.
Macro-Averaged Results
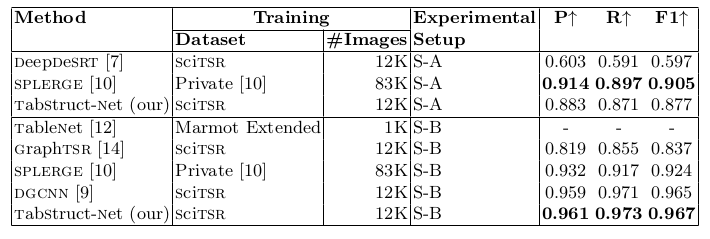
Table 12. Comparison of results for physical structure recognition on ICDAR-2013 dataset. P: indicates precision, R: indicates recall, F1: indicates F1 Score and #Images: indicates number of table images in the training set. SPLERGE [10] is the best performing model (with post-processing) on ICDAR-2013 dataset in S-A. TabStruct-Net is the best performing model on ICDAR-2013 dataset in S-B .
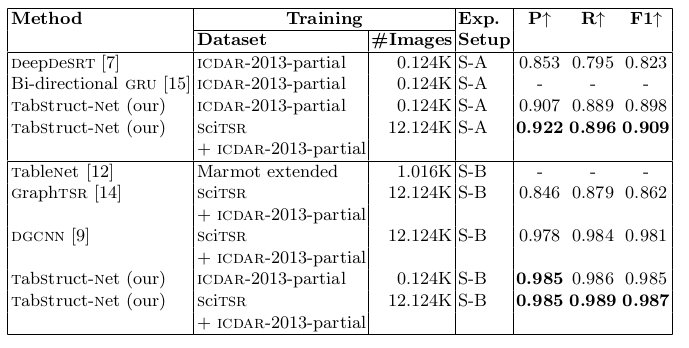
Table 13. Comparison of results for physical structure recognition on ICDAR-2013-partial dataset. P: indicates precision, R: indicates recall, F1: indicates F1 Score and #Images: indicates number of table images in the training set. TabStruct-Net is the best performing model on icdar-2013-partial dataset in both S-A and S-B .
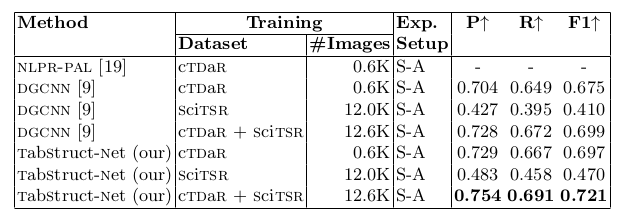
Table 14. Comparison of results for physical structure recognition on ICDAR-2019 (cTDaR) archival dataset. For comparison against DGCNN [9], we use the cell bounding boxes detected from tabstruct-net for a fair comparison. P: indicates precision, R: indicates recall, F1: indicates F1 Score and #Images: indicates number of table images in the training set. TabStruct-Net is the best performing model on ICDAR-2019 (cTDaR) archival dataset in both S-A and S-B .
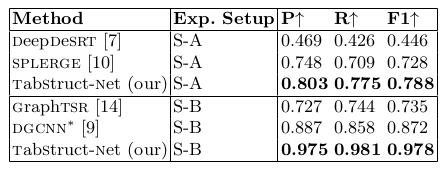
Table 13. Comparison of results for physical structure recognition on UNLV-partial dataset. P: indicates precision, R: indicates recall, F1: indicates F1 Score. All models are trained on SciTSR and fine-tuned on UNLV-partial datasets. TabStruct-Net is the best performing model on UNLV-partial dataset in both S-A and S-B.
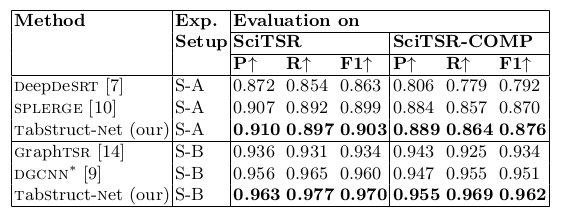
Table 14. Comparison of results for physical structure recognition on SciTSR and SciTSR-COMP datasets. P: indicates precision, R: indicates recall, F1: indicates F1 Score. All the models are trained on scitsr dataset. TabStruct-Net is the best best performing model on SciTSR and SciTSR-COMP datasets in both S-A and S-B.
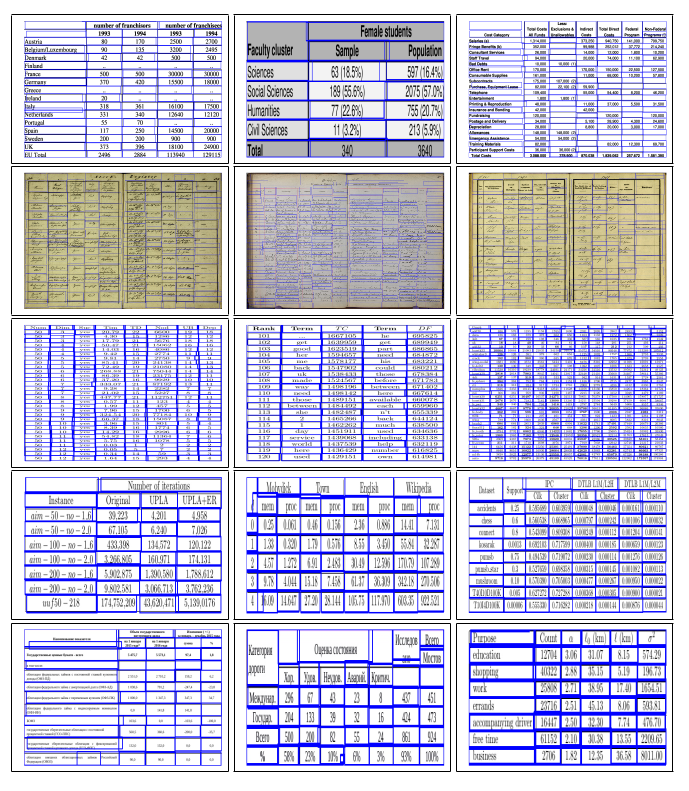
Fig. 2. Sample intermediate cell detection results of TabStruct-Net on table images of ICDAR-2013 (in First Row), ICDAR-2019 (in Second Row), SciTSR (in Third Row), SciTSR-COMP (in Fourth Row) and TableBank (in Fifth Row) datasets.
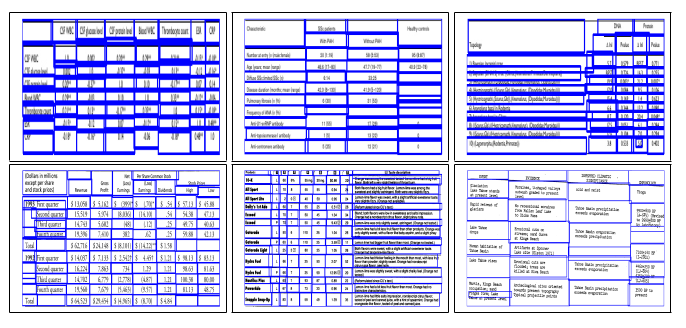
Fig. 3. Sample intermediate cell detection results of TabStruct-Net on table images of PubTabNet (in First Row) and UNLV (in Second Row) datasets.
Qualitative Results of Structure Recognition
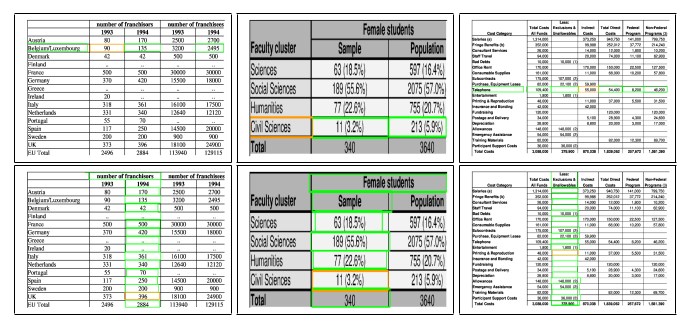
Fig. 4. Sample structure recognition output of TabStruct-Net on table images of ICDAR-2013 dataset. First Row: prediction of cells which belong to the same row. Second Row: prediction of cells which belong to the same column. Cells marked with orange colour represent the examine cells and cells marked with green colour represent those which belong to the same row/column of the examined cell.
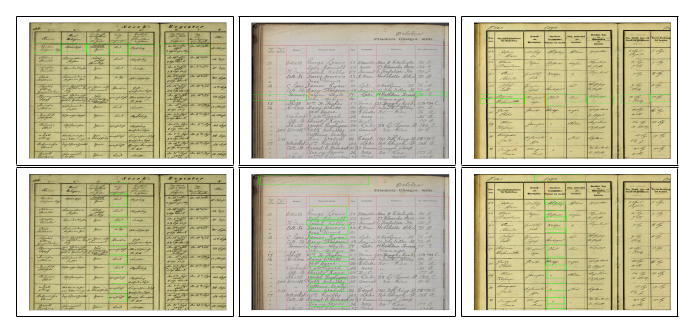
Fig. 5. Sample structure recognition output of TabStruct-Net on table images of ICDAR-2019 dataset. First Row: prediction of cells which belong to the same row. Second Row: prediction of cells which belong to the same column. Cells marked with orange colour represent the examine cells and cells marked with green colour represent those which belong to the same row/column of the examined cell.
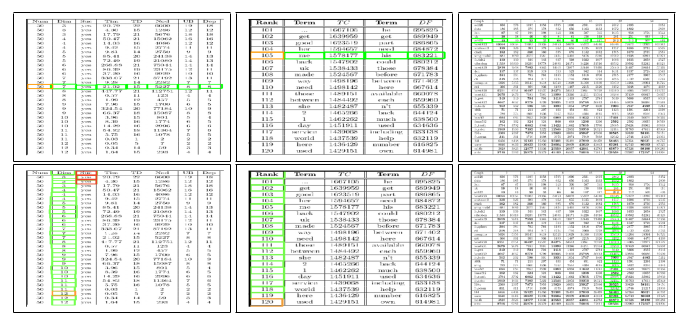
Fig. 6. Sample structure recognition output of TabStruct-Net on table images of SciTSR dataset. First Row: prediction of cells which belong to the same row. Second Row: prediction of cells which belong to the same column. Cells marked with orange colour represent the examine cells and cells marked with green colour represent those which belong to the same row/column of the examined cell.
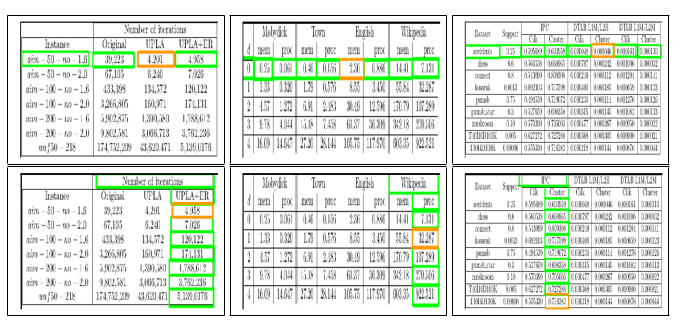
Fig. 7. Sample structure recognition output of TabStruct-Net on table images of SciTSR-COMP dataset. First Row: prediction of cells which belong to the same row. Second Row: prediction of cells which belong to the same column. Cells marked with orange colour represent the examine cells and cells marked with green colour represent those which belong to the same row/column of the examined cell.
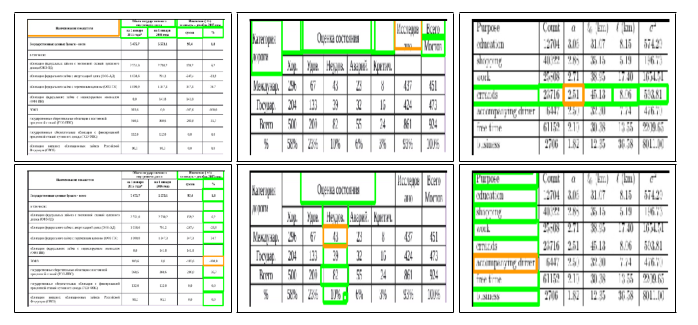
Fig. 8. Sample structure recognition output of TabStruct-Net on table images of TableBank dataset. First Row: prediction of cells which belong to the same row. Second Row: prediction of cells which belong to the same column. Cells marked with orange colour represent the examine cells and cells marked with green colour represent those which belong to the same row/column of the examined cell.
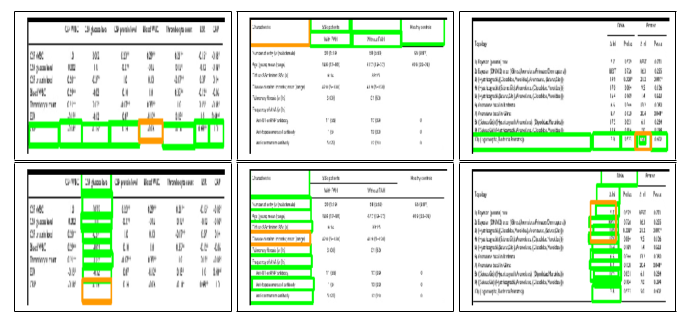
Fig. 9. Sample structure recognition output of TabStruct-Net on table images of PubTabNet dataset. First Row: prediction of cells which belong to the same row. Second Row: prediction of cells which belong to the same column. Cells marked with orange colour represent the examine cells and cells marked with green colour represent those which belong to the same row/column of the examined cell.
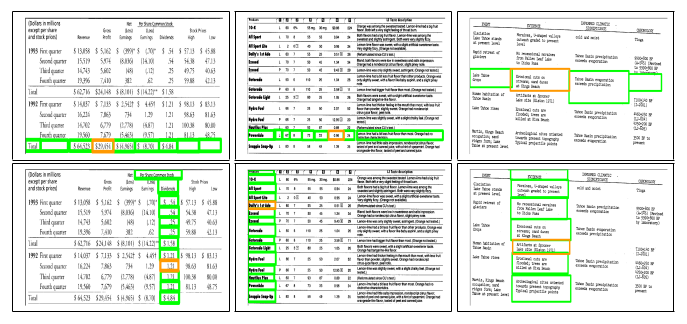
Fig. 10. Sample structure recognition output of TabStruct-Net on table images of UNLV dataset. First Row: prediction of cells which belong to the same row. Second Row: prediction of cells which belong to the same column. Cells marked with orange colour represent the examine cells and cells marked with green colour represent those which belong to the same row/column of the examined cell.
Robustness of TabStruct-Net
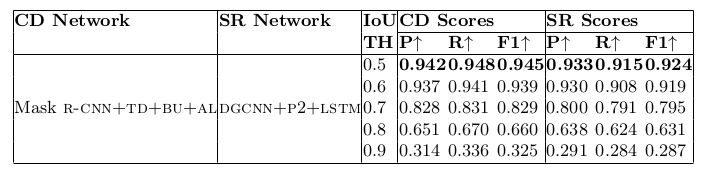
Table 15. Physical structure recognition results on ICDAR-2013-partial dataset for varying IoU thresholds to demonstrate TabStruct-Net’s robustness. ES: indicates Experimental Setup, CD: indicates Cell Detection, TH: indicates IoU threshold value, SR: indicates Structure Recognition, P2: indicates using visual features from P2 layer of the FPN instead of using separate convolution blocks, LSTM: indicates use of LSTMs to model visual features along center-horizontal and center-vertical lines for every cell, TD+BU: indicates use of Top-Down and Bottom-Up pathways in the FPN, AL: indicates addition of alignment loss as a regularizer to TabStruct-Net, P: indicates precision, R: indicates recall, F1: indicates F1 Score.
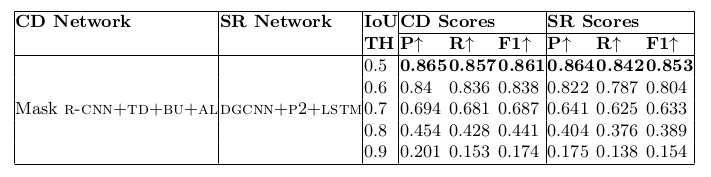
Table 16. Physical structure recognition results on ICDAR-2019 dataset for varying IoU thresholds to demonstrate TabStruct-Net’s robustness. ES: indicates Experimental Setup, CD: indicates Cell Detection, TH: indicates IoU threshold value, SR: indicates Structure Recognition, P2: indicates using visual features from P2 layer of the fpn instead of using separate convolution blocks, LSTM: indicates use of LSTMs to model visual features along center-horizontal and center-vertical lines for every cell, TD+BU: indicates use of Top-Down and Bottom-Up pathways in the FPN, AL: indicates addition of alignment loss as a regularizer to TabStruct-Net, P: indicates precision, R: indicates recall, F1: indicates F1 Score.
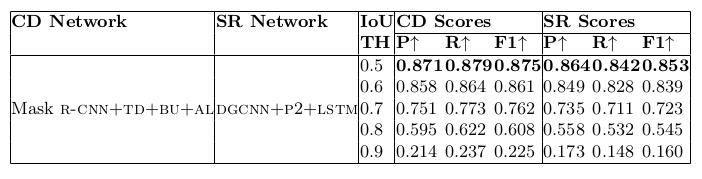
Table 17. Physical structure recognition results on UNLV-partial dataset for varying IoU thresholds to demonstrate TabStruct-Net’s robustness. ES: indicates Experimental Setup, CD: indicates Cell Detection, TH: indicates IoU threshold value, SR: indicates Structure Recognition, P2: indicates using visual features from P2 layer of the FPN instead of using separate convolution blocks, LSTM: indicates use of LSTMs to model visual features along center-horizontal and center-vertical lines for every cell, TD+BU: indicates use of Top-Down and Bottom-Up pathways in the FPN, AL: indicates addition of alignment loss as a regularizer to TabStruct-Net, P: indicates precision, R: indicates recall, F1: indicates F1 Score.
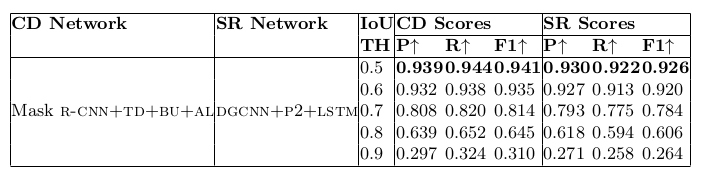
Table 18. Physical structure recognition results on SciTSR dataset for varying IoU thresholds to demonstrate TabStruct-Net’s robustness. ES: indicates Experimental Setup, CD: indicates Cell Detection, TH: indicates IoU threshold value, SR: indicates Structure Recognition, P2: indicates using visual features from P2 layer of the FPN instead of using separate convolution blocks, LSTM: indicates use of LSTMs to model visual features along center-horizontal and center-vertical lines for every cell, TD+BU: indicates use of Top-Down and Bottom-Up pathways in the FPN, AL: indicates addition of alignment loss as a regularizer to TabStruct-Net, P: indicates precision, R: indicates recall, F1: indicates F1 Score.
Ablation Study
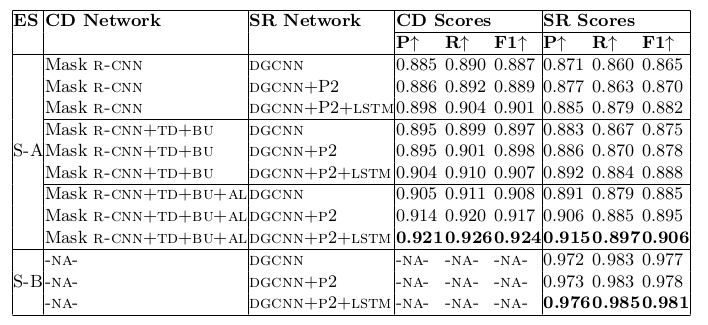
Table 19. Ablation study for physical structure recognition on ICDAR-2013 dataset. ES: Experimental Setup, CD: Cell Detection, SR: Structure Recognition, P2: using visual features from P2 layer of the FPN instead of using separate convolution blocks, LSTM: use of LSTMs to model visual features along center-horizontal and center-vertical lines for every cell, TD+BU: use of Top-Down and Bottom-Up pathways in the FPN, AL: addition of alignment loss as a regularizer to tabstruct-net.
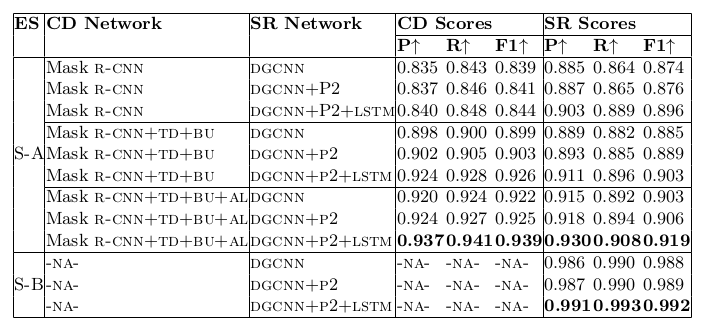
Table 20. Ablation study for physical structure recognition on ICDAR-2013-partial dataset. ES: indicates Experimental Setup, CD: indicates Cell Detection, SR: indicates Structure Recognition, P2: indicates using visual features from P2 layer of the FPN instead of using separate convolution blocks, LSTM: indicates use of LSTMs to model visual features along center-horizontal and center-vertical lines for every cell, TD+BU: indicates use of Top-Down and Bottom-Up pathways in the FPN, AL: indicates ad- dition of alignment loss as a regularizer to TabStruct-Net, P: indicates precision, R: indicates recall, F1: indicates F1 Score.
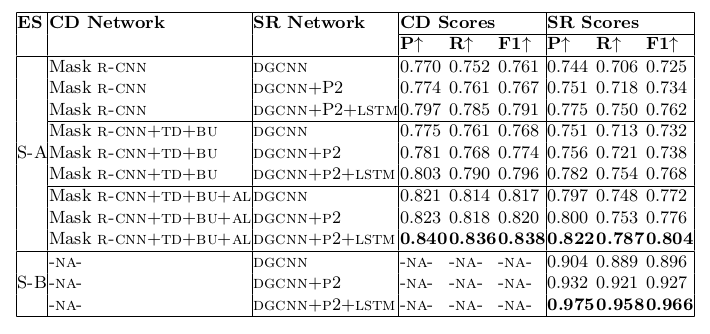
Table 21. Ablation study for physical structure recognition on ICDAR-2019 dataset. ES: indicates Experimental Setup, CD: indicates Cell Detection, SR: indicates Structure Recognition, P2: indicates using visual features from P2 layer of the FPN instead of using separate convolution blocks, LSTM: indicates use of LSTMs to model visual features along center-horizontal and center-vertical lines for every cell, TD+BU: indicates use of Top-Down and Bottom-Up pathways in the FPN, AL: indicates addition of alignment loss as a regularizer to TabStruct-Net, P: indicates precision, R: indicates recall, F1: indicates F1 Score.

Table 22. Ablation study for physical structure recognition on UNLV-partial dataset. ES: indicates Experimental Setup, CD: indicates Cell Detection, SR: indicates Structure Recognition, P2: indicates using visual features from P2 layer of the FPN instead of using separate convolution blocks, LSTM: indicates use of LSTMs to model visual features along center-horizontal and center-vertical lines for every cell, TD+BU: indicates use of Top-Down and Bottom-Up pathways in the FPN, AL: indicates addition of alignment loss as a regularizer to TabStruct-Net, P: indicates precision, R: indicates recall, F1: indicates F1 Score.
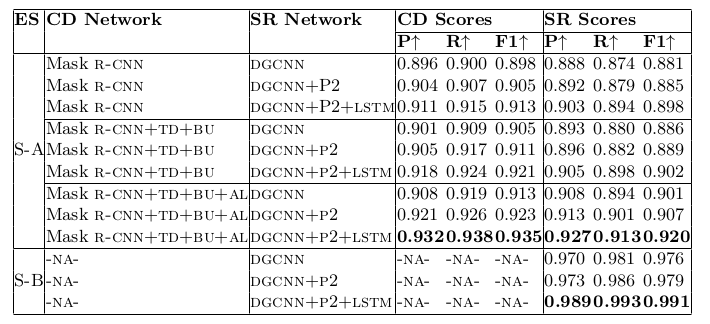
Table 23. Ablation study for physical structure recognition on SciTSR dataset. ES: indicates Experimental Setup, CD: indicates Cell Detection, SR: indicates Structure Recognition, P2: indicates using visual features from P2 layer of the FPN instead of using separate convolution blocks, LSTM: indicates use of LSTMs to model visual features along center-horizontal and center-vertical lines for every cell, TD+BU: indicates use of Top-Down and Bottom-Up pathways in the FPN, AL: indicates addition of alignment loss as a regularizer to TabStruct-Net, P: indicates precision, R: indicates recall, F1: indicates F1 Score.
Failure Examples
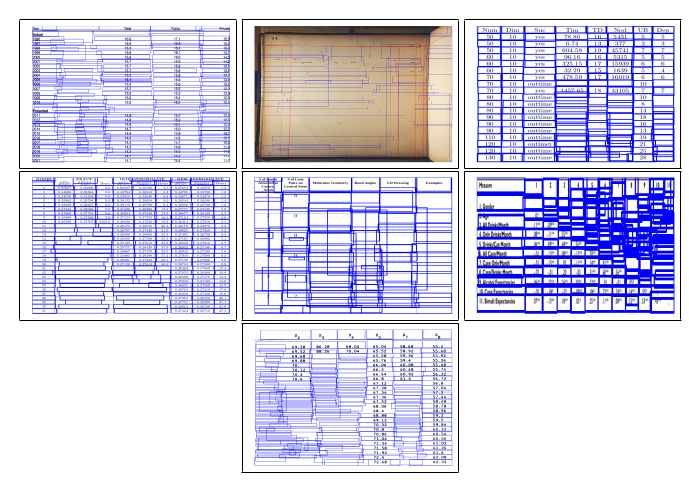
Fig. 11. Sample intermediate cell detection results of TabStruct-Net on table images of ICDAR-2013, ICDAR-2019 cTDaR, SciTSR, SciTSR-COMP, TableBank, PubTabNet and UNLV datasets illustrate failure of TabStruct-Net.
Link to the Download: [ Code ] & [ PDF ]
Publication
- Sachin Raja, Ajoy Mondal and C. V. Jawahar , Table Structure Recognition using Top-Down and Bottom-Up Cues , European Conference on Computer Vision (ECCV) 2020.
Cite this paper as:
Updated Soon
Team
- Sachin Raja
- Dr. Ajoy Mondal
- Prof. C. V. Jawahar