DocFigure: A Dataset for Scientific Document Figure Classification
Title: DocFigure: A Dataset for Scientific Document Figure Classification
Authors : K V Jobin, Ajoy Mondal and C. V. Jawahar
Abstract
Document figure classification (DFC) is an important stage of a document image understanding system. The design of a DFC system required a well defined figure categories and a dataset. To the best of the author’s knowledge, the existing datasets related to classification of figures in the document images are limited with respect to their size and categories [1]–[3]. In this paper, we introduce a scientific figure classification dataset, named as DocFigure. The dataset consists of 33K annotated figures of 28 different categories present in the document images which correspond to scientific articles published in CVPR, ECCV, ICCV, etc. conferences in the last several years. Manual annotation of such a large number (33K) of figures is time consuming and cost ineffective. In this article, we design a web based annotation tool which can efficiently assign category labels to large number of figures with the minimum efforts of human annotators. To benchmark our generated dataset on classification task, we propose three baseline classification techniques using deep feature, deep texture feature and combination of both. In our analysis, we found that the combination of both deep feature and deep texture feature is more effective for document figure classification task than the individual features.
Keywords: Document figure classification; transfer learning; deep feature; deep texture feature.
Dataset: DocFigure
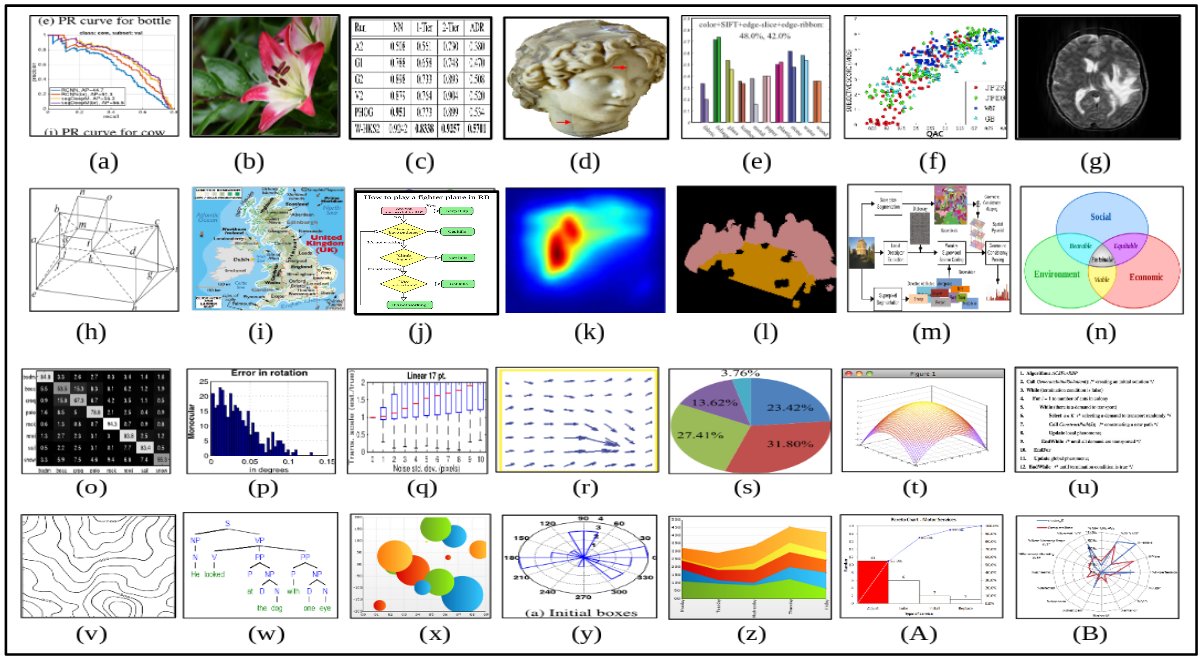
Fig1: Visual illustration of category wise sample figure images of our DocFigure dataset. The 28 categories corre- spond to (a) Line graph, (b) Natural image, (c) Table, (d) 3D object, (e) Bar plot, (f) Scatter plot, (g) Medical image, (h) Sketch, (i) Geographic map, (j) Flow chart, (k) Heat map, (l) Mask, (m) Block diagram, (n) Venn diagram, (o) Confusion matrix, (p) Histogram, (q) Box plot, (r) Vector plot, (s) Pie chart, (t) Surface plot, (u) Algorithm, (v) Contour plot, (w) Tree diagram, (x) Bubble chart, (y) Polar plot, (z) Area chart, (A) Pareto chart and (B) Radar chart.
Comparison of our DocFigure dataset with existing
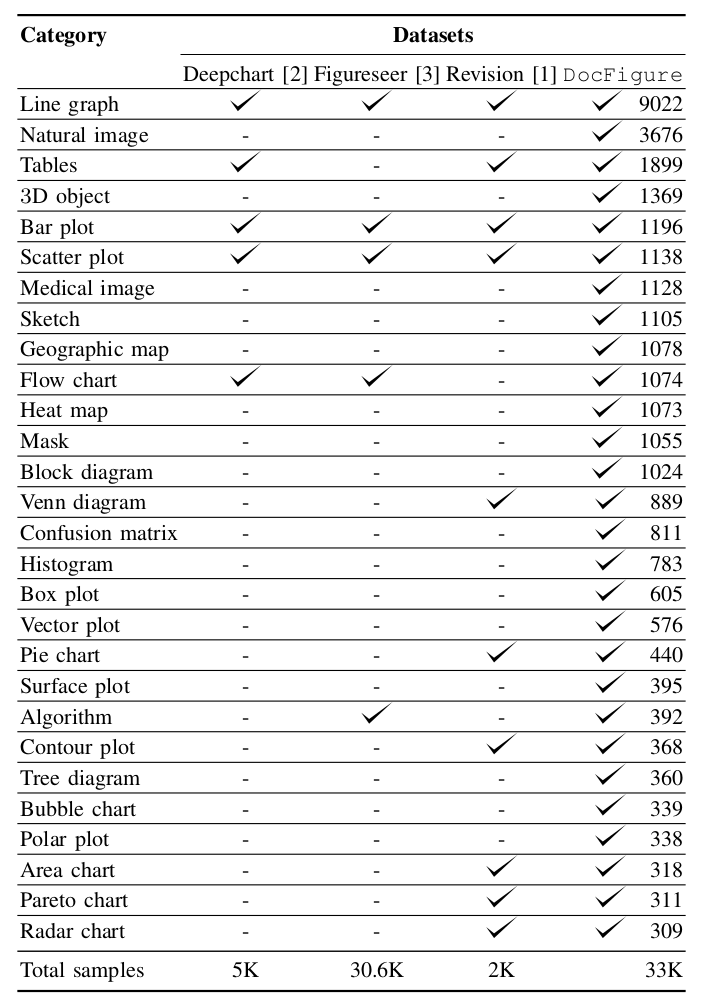
Table I: Comparison of our DocFigure dataset with existing Deepchart [2], Figureseer [3] and Revision [1] datasets with respect to category labels and samples. The last column indicate the number of images in each class.
Work-flow for generation of DocFigure dataset
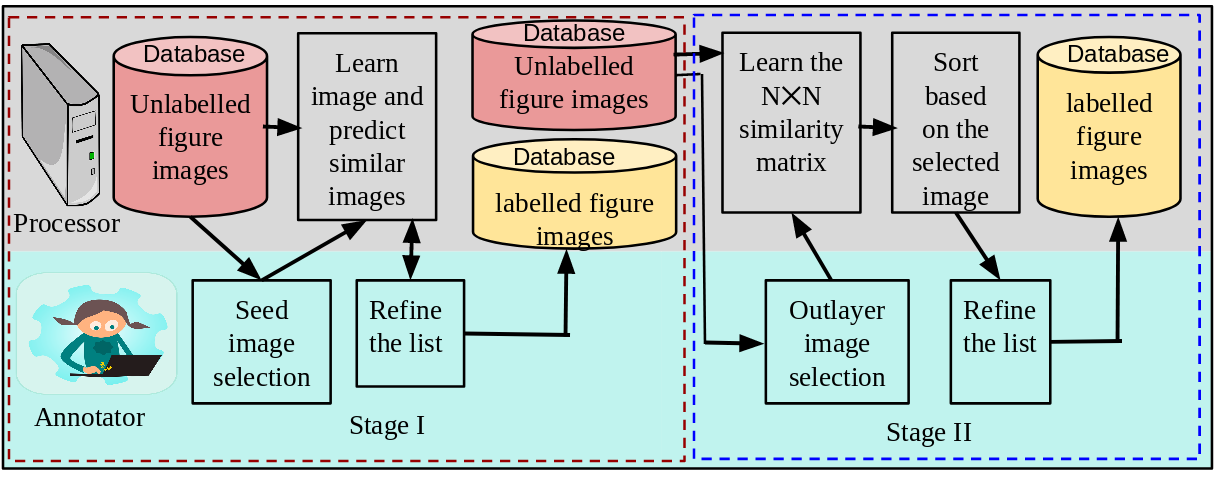
Fig2: Work-flow for generation of DocFigure dataset. Annotation is done using two stages. In stage I, part of the dataset is annotated using incremental learning and annotator. In stage II, remaining part is annotated based on similarity score between the rest of the images and help of annotator. Finally, complete annotated dataset is generated.
Link to the Download: [ Dataset ] * [ Code ] *
Note: * Their use is restricted to non-commercial research and educational purposes.
Baseline
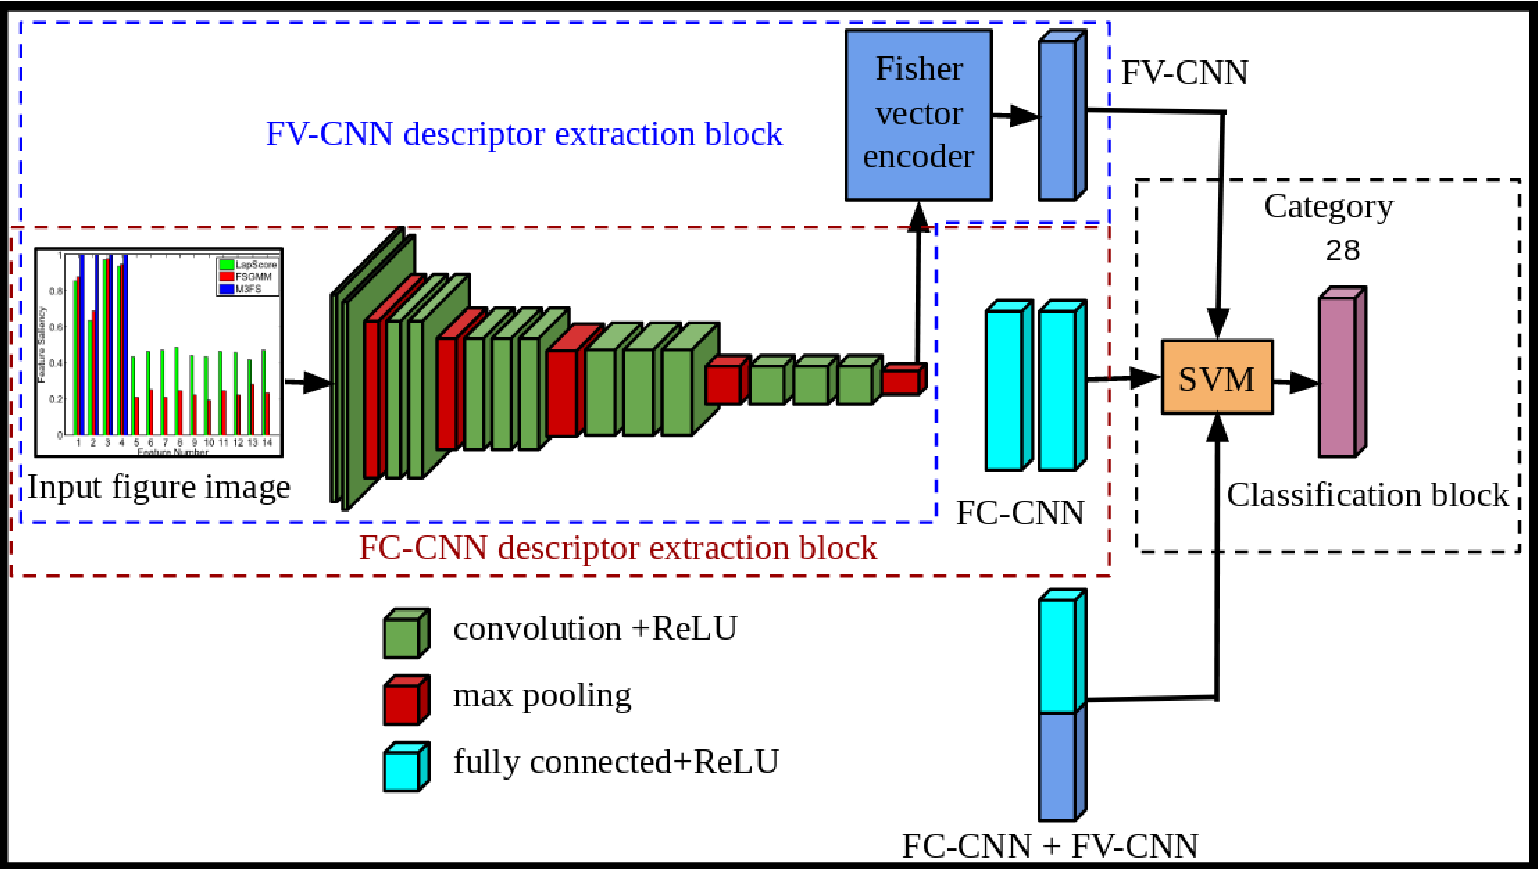
Fig3: Basic framework for the proposed three baseline approaches. Red dotted rectangle corresponds to FC - CCN features extraction block, Blue dotted rectangle indicates FV - CNN features extraction module and Black dotted rectangle corresponds to classification module (best viewed in color).
Results:
| Labels | FC-CNN | FV-CNN | FC-CNN + FV-CNN |
|---|---|---|---|
| 3D objects | 98.24% | 94.73% | 98.53% |
| Algorithm | 93.81% | 91.75% | 93.81% |
| Bar plots | 93.97% | 91.97% | 93.64% |
| Box plot | 91.39% | 88.07% | 92.05% |
| Flow chart | 92.53% | 91.14% | 97.01% |
| Heat map | 99.25% | 95.89% | 99.62% |
| Histogram | 94.89% | 88.26% | 94.89% |
| Medical images | 97.87% | 92.55% | 98.93% |
| Pie chart | 91.66% | 89.81% | 94.44% |
| Polar plot | 85.71% | 78.57% | 85.71% |
| Area chart | 84.61% | 91.02% | 92.30% |
| Block diagram | 97.26% | 97.65% | 98.43% |
| Bubble Chart | 80.95% | 91.66% | 90.47% |
| Confusion matrix | 85.22% | 89.65% | 93.10% |
| Contour plot | 59.34% | 74.72% | 72.52% |
| Geographic map | 88.59% | 95.81% | 95.43% |
| Line graph * | 98.49% | 98.84% | 99.33% |
| Mask | 99.23% | 99.23% | 99.23% |
| Natural images | 98.04% | 98.25% | 99.23% |
| Pareto charts | 87.17% | 96.15% | 97.43% |
| Radar chart | 78.94% | 86.84% | 85.52% |
| Scatter plot | 90.14% | 91.19% | 93.66% |
| Sketches | 95.65% | 96.37% | 98.18% |
| Surface plot | 76.76% | 89.89% | 88.88% |
| Tables | 97.25% | 98.73% | 97.67% |
| Tree Diagram | 67.04% | 68.18% | 70.45% |
| Vector plot | 79.86% | 81.94% | 86.80% |
| Venn Diagram | 87.03% | 93.51% | 93.05% |
| Average | 88.96% | 90.80% | 92.90% |
Table3: The class wise accuracy of 28 classes in our
proposed dataset DocFigure using shape feature (FC-
CNN), texture feature (FV-CNN) and combination of both
(FC-CNN+FV-CNN). The labels written in italics are more
discriminative in shape feature than texture feature.
Note: * By mistake in the main paper we named Line graph as Graph plots.
Publication
- K V Jobin, Ajoy Mondal and C V Jawahar , DocFigure: A Dataset for Scientific Document Figure Classification , 2019 International Conference on Document Analysis and Recognition Workshops (ICDARW), Sydney, NSW, Australia, 2019
Bibtex
@InProceedings{jobin2019,
author = "K V Jobin, Ajoy Mondal and C V Jawahar",
title = "Graphical Object Detection in Document Images",
booktitle = "2019 International Conference on Document Analysis and Recognition Workshops (ICDARW)",
year = "2019"
}