Result
Comparison Between our Single Model CDeC-Net‡ and State-of-the-Art
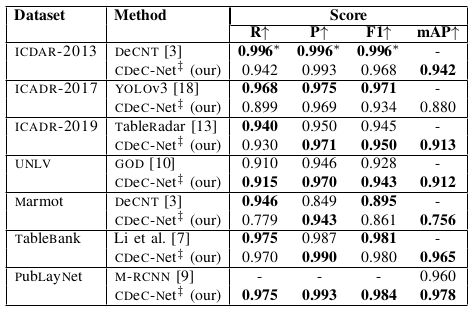
Table I: Illustrates comparison between our single model CDeC-Net‡ and state-of-the-art techniques on existing benchmark datasets. We create the single model CDeC-Net‡ by training CDeC-Net With IIIT-AR-13K and fine-tuning with training set of respective datasets. *: indicates the authors reported 0.996 tn table however in discussion they mentioned 0.994.
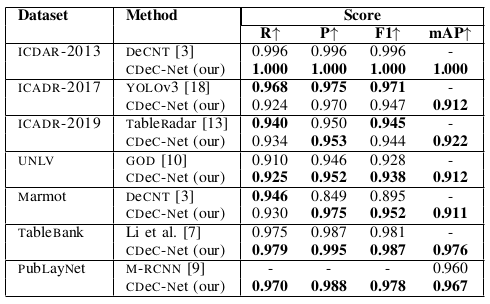
Table III: Illustrates comparison between CDeC-Net and state-of-the-art techniques on the existing benchmark datasets.
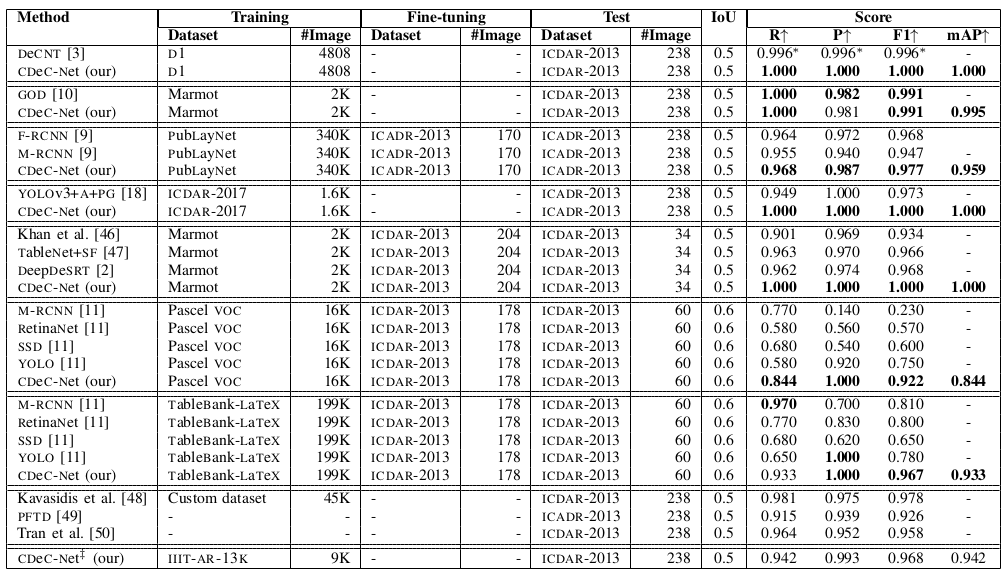
Table IV: Illustrates comparison between the proposed CDeC-Net and state-of-the-art techniques on ICDAR-2013 dataset. A: indicates anchor optimization, Pg: indicates post-processing technique, Sf: indicates semantic features, D1: indicates Marmot+UNLV+ICDAR-2017, *: indicates the authors reported 0.996 in Table however in discussion they mentioned 0.994. CDeC-Net‡: indicates a single model which is trained with IIIT-AR-13K dataset.
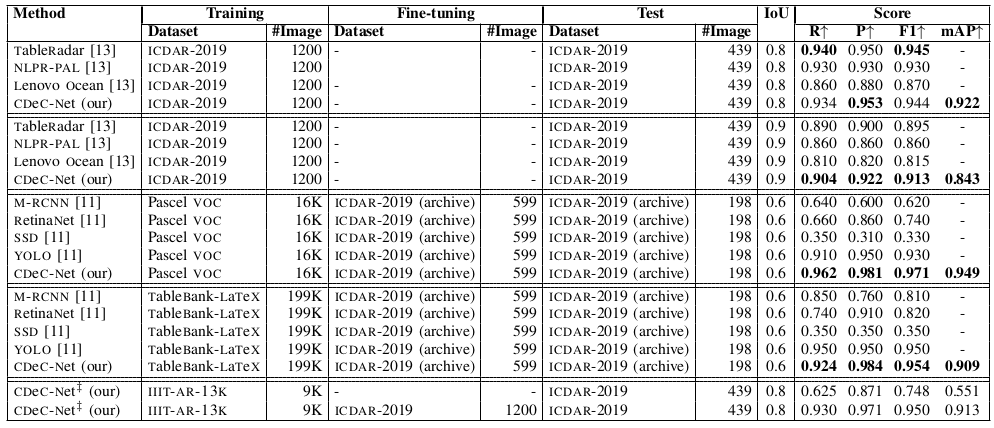
Table V: Illustrates comparison between the proposed CDeC-Net and state-of-the-art techniques on ICDAR-2019 dataset. CDeC-Net‡: indicates a single model which is trained with IIIT-AR-13K dataset.
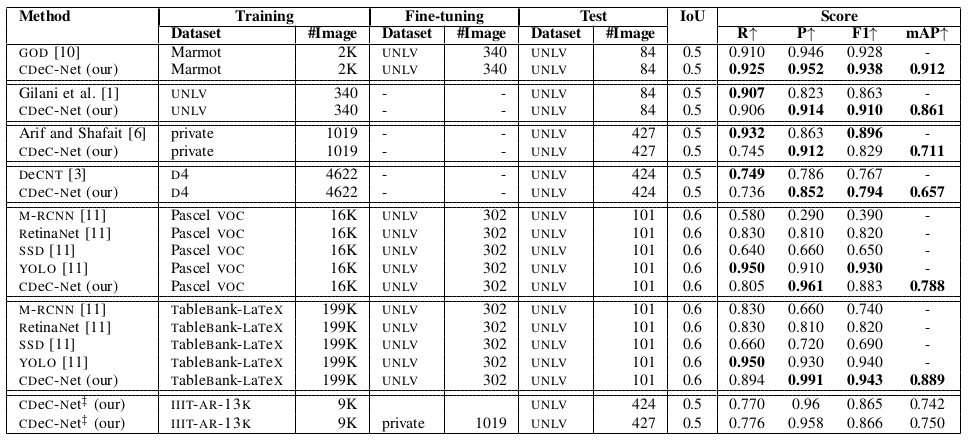
Table VI: Illustrates comparison between the proposed CDeC-Net and state-of-the-art techniques on UNLV Dataset. D4: indicates ICDAR-2013+ICDAR-POD-2017+Marmot. CDeC-Net‡: indicates a single model which is trained with IIIT-AR-13K dataset.
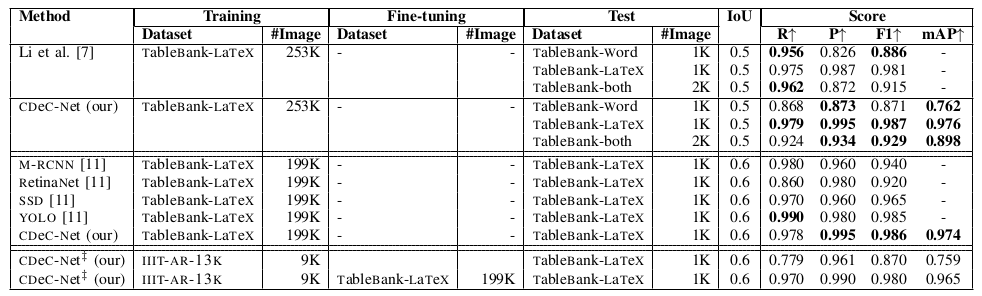
Table VII: Illustrates Comparison between the proposed CDeC-Net (our) and state-of-the-art techniques on TableBank dataset. CDeC-Net‡: indicates a single model which is trained with IIIT-AR-13K dataset.
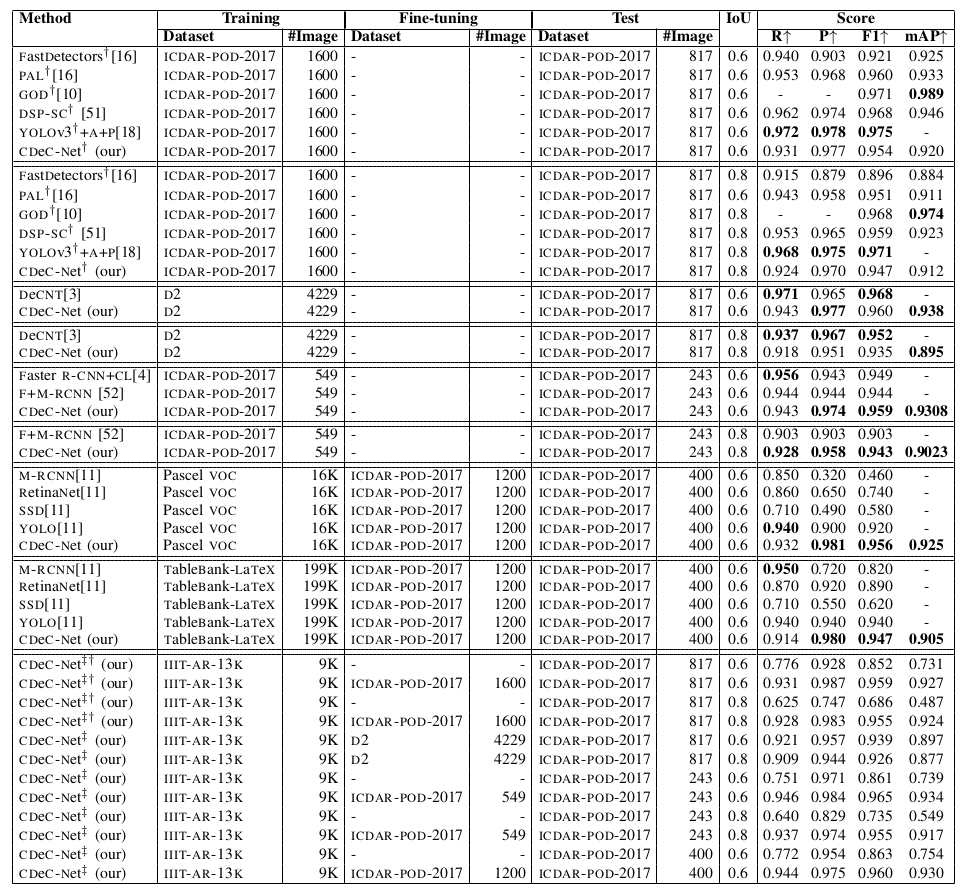
Table X:Illustrates comparison between the proposed CDeC-Net and state-of-the-art techniques on ICDAR-POD-2017. D2: indicates ICDAR-2013+ICDAR-POD-2017+UNLV+Marmot. †: indicates model trained with multiple categories. CDeC-Net‡: indicates a single model which is trained with IIIT-AR-13K dataset.
Table XI: Illustrates comparison between the proposed CDeC-Net and state-of-the-art techniques on ICDAR-POD-2017. D2: indicates ICDAR-2013+ICDAR-POD-2017+UNLV+Marmot. †: indicates model trained with multiple categories. CDeC-Net‡: indicates a single model which is trained with IIIT-AR-13K dataset.
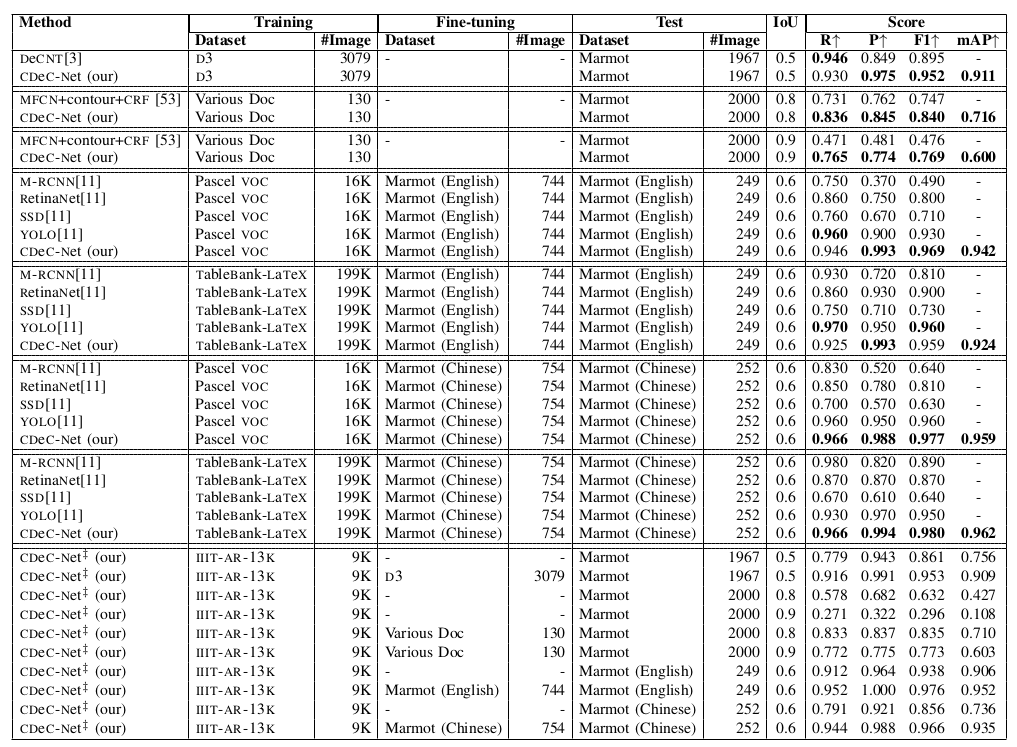
Table XII: Illustrates comparison between the proposed CDeC-Net and state-of-the-art techniques on Marmot dataset. D3: indicates ICDAR-2013+ICDAR-POD-2017+UNLV. CDeC-Net‡: indicates a single model which is trained with IIIT-AR-13K dataset.
Ablation Study
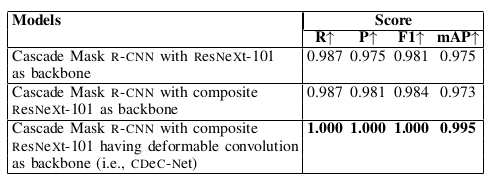
Table IX: Illustrates the performances of various models. All models are tested on ICDAR-2013 dataset with 0.5 as IoU threshold. Cascade Mask R-CNN with composite ResNeXt-101 having deformable convolution as Backbone i.e., CDeC-Net obtains best results as compared to other models. We select CDeC-Net as our final model.
Effect of IoU Threshold on Table Detection
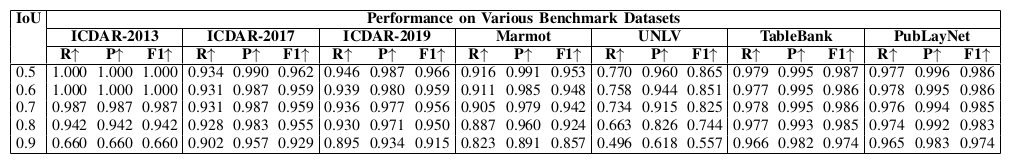
Table XIIIIllustrates the performance of CDeC-Net under varying IoU thresholds.
Qualitative Results
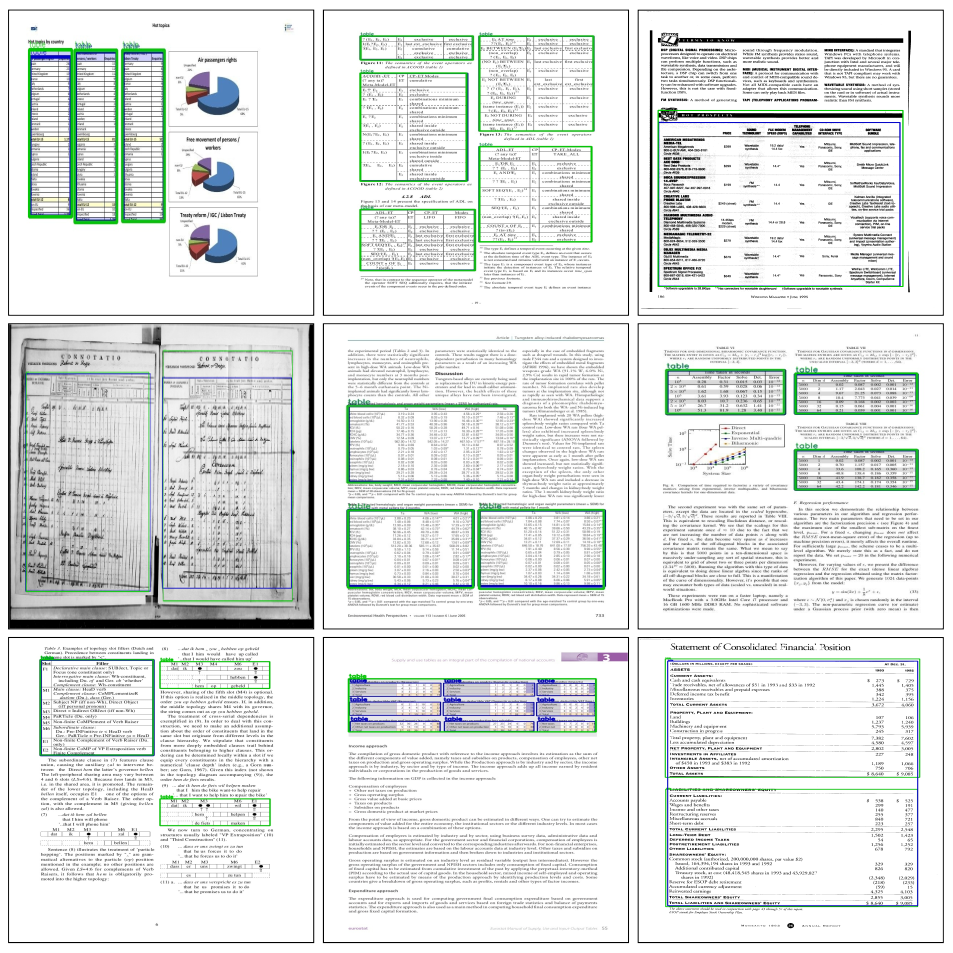
Fig. 3:Illustration of complex table detection results. Blue and Green colored rectangles correspond to ground truth and predicted bounding boxes using CDeC-Net. First and Second Rows: show examples where CDeC-Net accurately detects the tables. Third Row: shows examples where CDeC-Net fails to accurately detect the tables.
Fig. 4:Illustration visual results of the state-of-the-art CDeC-Net model and single CDeC-Net‡ model. Blue, Green, and Red colored rectangles correspond to ground truth and predicted bounding boxes using state-of-the-art CDeC-Net and single CDeC-Net‡ model respectively. First Row: shows examples where CDeC-Net‡ detects table accurately and CDeC-Net fails to detect table accurately. Second Row: shows examples where CDeC-Net detects table accurately and CDeC-Net‡ fails to detect table accurately.