|
|
Brain is one of the most complex and sophisticated organs in human body.It is the center of nervous system and responsible for motor actions,memory and intelligence in humans. Study of structure, function and disease in human brain is done by analyzing images obtained in different modalities like Magnetic Resonance Imaging (MRI) and Computed Tomography (CT).
Following are some of the research projects of our group in the field.
- Construction of Indian Human Brain Atlas
Structural magnetic resonance images (MRI) provide anatomical information about the brain in healthy as well as in diseased conditions. On the other hand, functional MRI (fMRI) provides information on the brain activity during performance of a specific task. Analysis of fMRI data requires the registration of the data to a reference brain atlas in order to identify the activated brain regions. Brain atlases help represent information using a common co-ordinate system.
Read More...
Brain atlases find many applications: Analysis of diffusion tensor imaging and multi-voxel spectroscopy. Population-specific analysis based on normative data (e.g., brain shape and size) for Alzheimer’s disease (AD), dementia and other heuro-degenerative disease diagnosis.
In this project, we focus on the construction of the atlas of the Human Brain for the Indian population. In the current pilot phase, data has been sourced from 50 normal (21-30 yrs of age) subjects from two different scanners (GE and Siemens). When, scans are collected from different manufacturer, there is a need to standardize their intensity range, as they vary from scanner to scanner. We address this issue by proposing a novel standardization method.
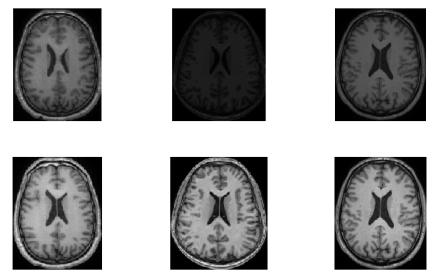 Sample images from GE, Siemens and Phillips scanners (left to right) before (top row) and after (bottom row) Intensity Standardization
Post standardization, the volumes are to be registered to derive a probabilistic atlas.
- Analysis of Stroke on Brain CT Scans
Stroke is a disease which affects vessels that supply blood to the brain. A stroke occurs when a blood vessel either ruptures or is blocked at some location. The latter disrupts blood flow leading to cell death due to lack of oxygen.
Read More...
Strokes are mainly classified in two categories:
1) Ischemic stroke or infarct (due to lack of blood supply)
2) Hemorrhagic stroke (due to rupture of blood vessel)

 (L) Ischemic Stroke, (R) Hemorrhagic Stroke
MRI(DWI) are the preferred modality for detection of stroke. Due to resource constraints MR scanners are not as widely available as Computed tomography (CT) scanners in some countries. CT scans are also faster and less expensive. Hence, this work investigates the use of CT for stroke detection.
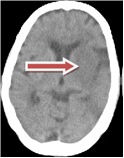
 (L) Early Stage Infarct, (R) Old Infarct
An automated method to detect (from non-contrast CT images) and classify an abnormality into acute infarct, chronic infarct and hemorrhage at the slice level has been developed. The proposed method is based on the observation that stroke presence disturbs the natural contra-lateral symmetry of a slice. Accordingly, we characterize stroke as a distortion between the two halves of the brain in terms of tissue density and texture distribution.
- Detection and Segmentation of Stroke Lesions from Diffusion Weighted MR images of the Brain
Time is of the essence during stroke analysis since the window of therapy is very small (< 3 hrs after the onset of symptoms). Recent clinical studies have shown the usefulness and significance of diagnosing stroke on the Diffusion Weighted Magnetic Resonance Imaging (DWI) scans of the brain in the early stages.
Read More...
Varying the acquisition parameter (b-value) generates different DWI scans with varied contrast. DWI with higher b-values provide improved sensitivity, conspicuity of stroke lesions and reduced artifacts at the cost of lower SNR. Along with the DWI scans, the Apparent Diffusion Coefficients (ADC) maps are also derived which give a measure of the true diffusion process in the brain irrespective of the acquisition artifacts that resemble stroke.
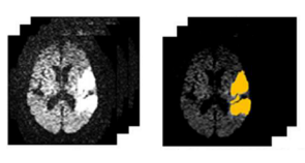 (L) DWI image, (R) Segmented Stroke
An automated framework comprising of three stages is proposed for accurately capturing the stroke lesions: (i) Stroke Detection (ii) Contrast Enhancement and (iii) Stroke Segmentation, utilizing information from low and high b-valued DWI data and the ADC maps
The detection stage utilizes the information from lower b-value data and the ADC data to identify the stroke lesions on the higher b-value data and reject the false positives due to low SNR in high b-value data. The detected stroke lesions are segmented using the higher b-value data and ADC information. Integrating information from the higher b-value data along with the ADC data helps better define the stroke lesion in the segmentation stage. An auto-windowing technique is designed to enhance the contrast of the stroke lesions in the DWI data prior to segmentation. The contrast enhancement scheme also assists the radiologists in the manual/visual diagnosis of stroke in DWI scans.
- Patient-Motion Analysis in Perfusion Weighted MRI
Information about blood flow in the brain is of interest to detect the presence of blockages and ruptures in the vessel network. A standard way of gathering this information is to inject a bolus of contrast agent into the blood stream and imaging over a period of time.
Read More...
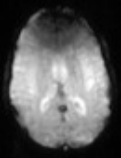
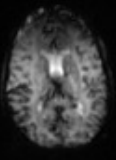 (L) Normal PWI slice, (R) Bolus effected PWI slice
The imaging is generally done over an extended period of time (tens of minutes) during which a patient can move which in turn results in corruption of the acquired time series of volumes. This problem is often observed in dynamic magnetic resonance (MR) imaging. Correction for motion after scanning is a highly time-intensive process since it involves registering each volume to a reference volume. Moreover, the injected contrast alters the signal intensity as a function of time and often confounds traditional motion correction algorithms
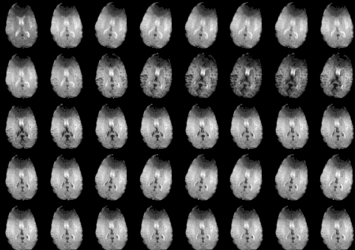 PWI-MRI time series
We have developed a fast and efficient solution for motion correction in 3D dynamic susceptibility contrast (DSC) MR images. This is in the form of a robust, multi-stage system based on a divide and conquer strategy consisting of the following steps: i) subdivision of the time series data into bolus and non-bolus phases depending on the status of bolus in the brain, ii) 2D block-wise phase correlation for detecting motion between adjacent volumes and categorizing the corruption into four categories: none, minimal, mild and severe depending on the degree of motion and iii) a 2-pass, 3D registration consisting of intra-set and inter-set registrations to align the motion corrupted volumes
The subdivision of time-series into distinct sets is achieved using Gamma variate function (GVF) fitting. The dynamic nonuniform variation in signal intensity due to the injected bolus is handled by employing a clustering-based identification of bolus-affected pixels followed by correction of their intensity using the above GVF fitting.
- Segmentation and Structural Analysis of Hippocampus from MRI
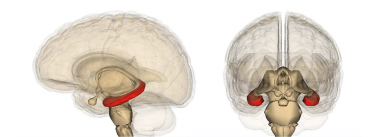
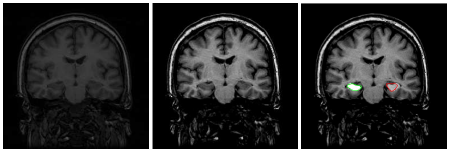
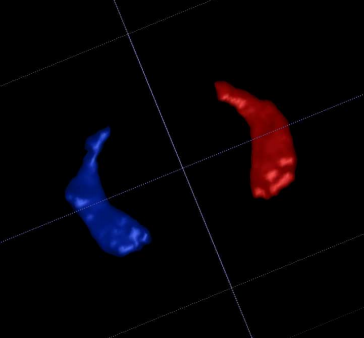
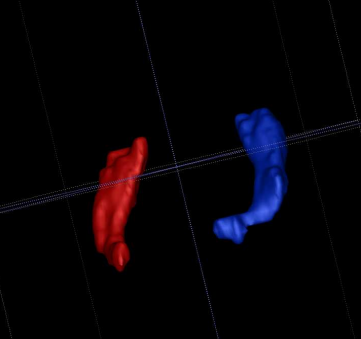
Alzheimer’s disease (AD) is a neurodegenerative disease with crippling effect on human mind and yet, there is no known cure to this disease.Memory problems are one of the first signs of Alzheimers disease. The hippocampus is a part of the mesial temporal lobe memory system known to be damaged and atrophied at an early stage of AD. Hence, the detection of its early onset proves to be helpful to monitor and regulate its progress.
Read More...
|
|
| Medical Image Processing, CVIT, IIIT, Hyderabad
|
| Last Modified: Oct 31 2018
|
|
|