Resources
- Resources
- Datasets
To promote transparent, reproducible, and collaborative research, our annotated datasets are made freely available to the public for non-commercial purposes.
Send us an email to request access to our datasets. Please note that all users of our datasets are expected to acknowledge the MIP group in their publications and presentations with the following information: "This research used data provided by the Medical Image Processing (MIP) group, IIIT Hyderabad".
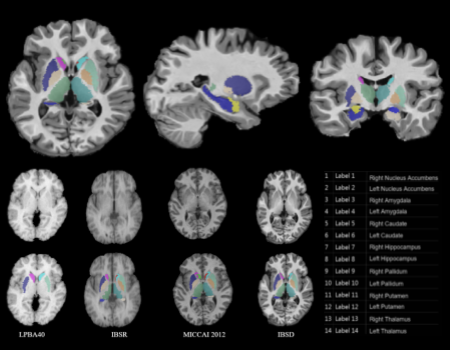
Indian Brain Segmentation Dataset (IBSD) consists of high-quality 1.5T T1w MRI data of 114 subjects generated under fixed imaging protocol along with corresponding manual annotation data of 14 sub-cortical structures done by expert radiologists. The number of MR scans in the dataset consists of an approximately equal number of male and female subjects belonging to a young age group (20-30 years). This data has been used to create a template for the young Indian population. This dataset can also be utilized for variety of tasks such as segmenting structures of interest, aligning/ registering images, etc, using traditional methods as well as Deep Learning approaches since it has adequate quantity of high quality data.
If you use this dataset, we encourage you to cite the following paper:
Sub-cortical Structure Segmentation Database for Young Population from arXiv preprint arXiv:2111.01561 2021
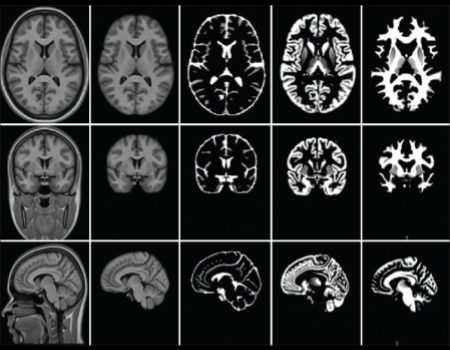
The aim of the IBA study is to construct and validate the Indian brain MRI atlas of young Indian population and the corresponding structure probability maps. 100 young healthy adults (M/F = 50/50), aged 21–30 years, were recruited for the study. The subjects were divided into three groups with each group having approximately equal male and female subjects. The first group (17M/16F) was scanned using a Siemens 1.5-T MRI scanner with T1 MPRAGE sequence, second group (16M/17F) was scanned using a GE 1.5-T MRI scanner with T1 BRAVO sequence, while the last group (17M/17F) was scanned using a Phillips 1.5-T MRI scanner for T1 3D TFE sequence. An atlas was constructed with all the 100 T1 MRI volumes by a nonrigid groupwise registration method. The atlas derived from 100 volumes will henceforth be referred to as the IBA100 atlas. Two gender-specific atlases (IBA50M for male and IBA50F for female) were also constructed using the same pipeline.
If you use this dataset, we encourage you to cite the following paper:
Construction of Indian Human Brain Atlas from Neurology India 2019
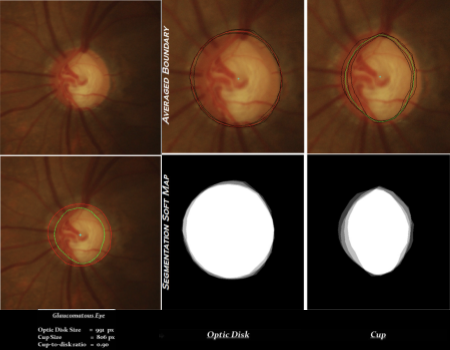
The dataset DRISHTI-GS consists of a total of 101 images. It is divided into 50 training and 51 testing images. All images were collected at Aravind eye hospital, Madurai from visitors to the hospital, with their consent. Galucoma patient selection was done by clinical investigators based on clinical findings during examination. Selected patients were 40-80 years of age, with roughly equal number of males and females. Patients undergoing routine refraction test and were not glaucomatous were chosen to represent the normal class. The ground truth for each image comprises of three different pieces of information: region boundary, segmentation soft map and cup-to-disk ratio. For each image, ground truth was collected from four glaucoma experts with experience of 3, 5, 9, and 20 years, respectively to capture inter-observer variance in marking.
If you use this dataset, we encourage you to cite the following papers:
1. Drishti-GS: Retinal Image Dataset for Optic Nerve Head (ONH) Segmentation from IEEE ISBI 2014
2. A Comprehensive Retinal Image Dataset for the Assessment of Glaucoma from the Optic Nerve Head Analysis from JSM Biomedical Imaging Data Papers 2015

We present a comprehensive dataset of retinal images of both normal and glaucomatous eyes with manual segmentations from multiple human experts. The dataset also provides expert opinion on an image representing a normal or glaucomatous eye and on the presence of notching in an image. DRISHTI-GS1 consists of 50 training and 51 testing images. For each image, manual segmentations are collected for both OD and cup region from four different human experts with varying clinical experience. Markings were collected with a dedicated marking tool which provides a fully deformable circle to enable capturing different OD and cup shapes, along with any localized shape changes such as notching. DRISHTI-GS1 is an extension of DRISHTI-GS with two other expert opinions included. These are decisions on i) the image as representing a Normal or Glaucomatous eye and ii) presence or absence of notching in the inferior and/or superior sectors of the image.
If you use this dataset, we encourage you to cite the following papers:
1. Drishti-GS: Retinal Image Dataset for Optic Nerve Head (ONH) Segmentation from IEEE ISBI 2014
2. A Comprehensive Retinal Image Dataset for the Assessment of Glaucoma from the Optic Nerve Head Analysis from JSM Biomedical Imaging Data Papers 2015
We examine strategies for scrutinizing colour fundus images which affect diagnostic performance of medical practitioners via an eye-tracking study. A dataset of 40 images with approximately equal number of normal and abnormal cases was selected by senior retina consultant from this experiment. This set contains images with various level of diagnostic difficulties. In order to maintain diversity among the participants, retina experts were invited from 6 different eye hospitals. A total of 44 retina experts, classified into 3 categories, namely consultants, fellows and residents/optometrists, participated in the study. 12 engineering students from our home institute were also included to fulfill the role of novices. Experiments were carried out in a dark room with constant environment condition. Tobii X2-30 eye tracker (sampling rate 30Hz) with a 15.6'' display screen were used. Tobii X2-30 eye-tracker allows free head movement of 20'' x 14'' (Width x Height) at the distance of 70m.
If you use this dataset, we encourage you to cite the following paper:
Scan, Dwell, Decide: Strategies for Detecting Abnormalities in Diabetic Retinopathy from PLOS ONE 2018

Normalization of images to a single coordinate frame via registration to the MT is useful in applications such as the segmentation of anatomical structures, disease detection and therapy planning. We have constructed an atlas for normal OCT volumes which can be used in many applications such as extraction a clinically relevant ROI for analysis, characterize abnormalities as deviations from the Normative atlas or to provide intra-retinal tissue layer segmentations. The construction of the atlas involves a groupwise registration of a set of preprocessed OCT volumes followed by computing their average to obtain the MT. A Sharp Means based iterative method was adapted for this task. In each iteration, all OCT volumes are registered to the current mean intensity template and their weighted average is used to update Mt.
If you use this dataset, we encourage you to cite the following paper:
Construction of a Retinal Atlas for Macular OCT Volumes from ICIAR 2018
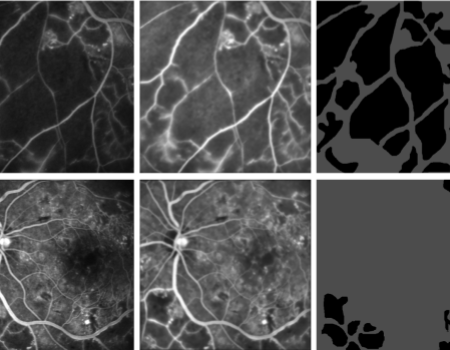
Capillary Non-Perfusion (CNP) is a condition in diabetic retinopathy where blood ceases to flow to certain parts of the retina, potentially leading to blindness. This study consists of 40 images of size 512 × 512,each of which contained many capillary non-perfusions (CNPs). These were acquired from the digital confocal scanning laser ophthalmoscope of Heidelberg Retina Angiograph. The images were of retinal segments for which the ground truth, in the form of boundaries of capillary non-perfusions, were prepared manually by a retina expert. CNP regions are shown in black in both ground truth and segmented results. The dataset has variability in images in terms of quality, size of CNPs and presence of other structures such as optic disk, macula and microaneurysms. The CNP dataset is available upon reasonable request.
If you use this dataset, we encourage you to cite the following paper:
Extraction of Capillary Non-perfusion from Fundus Fluorescein Angiogram from BIOSTEC 2008